Practical Geography Skills
From the Geography p1 curriculum
TL;DR
Practical geography skills involve understanding and applying techniques to collect, analyse, and present geographical information, often through fieldwork and mapping. You'll learn how to interpret maps, gather data effectively, and communicate your findings clearly. Mastering these skills helps you make sense of the world around you, from local environmental changes to global patterns.
1. The Mental Model
Think of yourself as a geographical detective. You observe clues (data), use tools (maps, instruments) to understand them, and then present your findings to explain what's happening in a place. It's all about moving from observing to understanding to communicating.
2. The Core Material
Practical geography skills cover a range of abilities essential for studying our world. We'll focus on map skills, data collection, and data presentation.
Map Skills
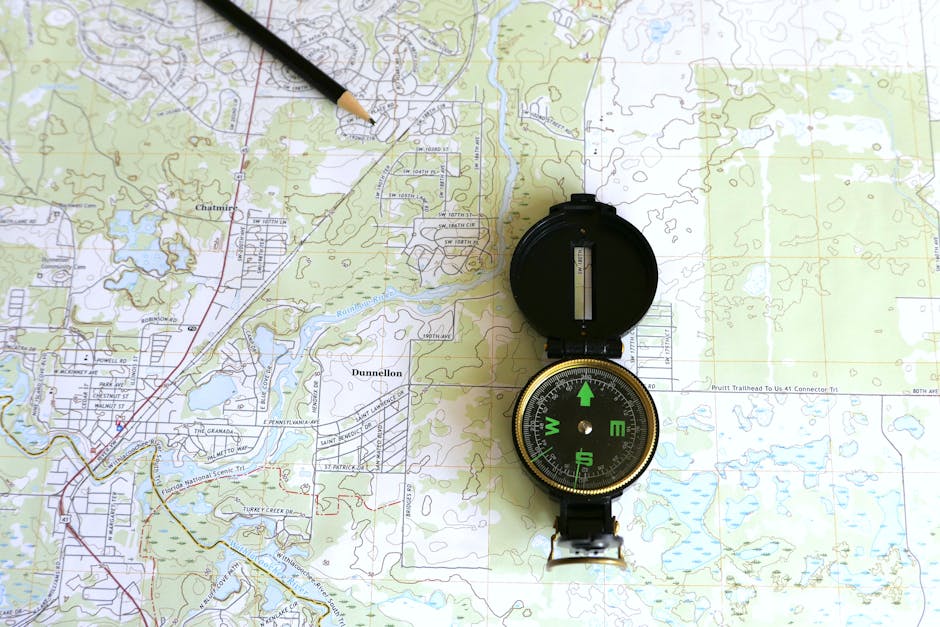
Photo by Larry Hyler on Pexels
Map skills are fundamental. You need to be able to read and interpret different types of maps to understand spatial relationships.
- Scale: This tells you the relationship between a distance on the map and the actual distance on the ground.
- Ratio Scale:
1:50,000means 1 unit on the map is 50,000 units in reality (e.g., 1 cm on map = 50,000 cm or 500 m on ground). - Linear Scale: A bar line marked with distances.
- Ratio Scale:
- Direction: Typically shown by a North arrow. You use bearings (degrees from North, clockwise) or cardinal points (N, S, E, W) to describe locations.
- Grid References: Used to pinpoint exact locations.
- Four-figure grid reference: Locates a 1km square. Read Eastings (numbers along the bottom) first, then Northings (numbers up the side).
- Six-figure grid reference: Locates a 100m square within a 1km square by estimating the tenths.
- Contour Lines: Lines on a map joining points of equal elevation above sea level.
- Closely spaced contours indicate a steep slope.
- Widely spaced contours indicate a gentle slope.
- V-shapes pointing uphill indicate a valley; V-shapes pointing downhill indicate a ridge.
- Symbols and Key: Maps use symbols (pictures, colours) to represent real-world features. The key explains what each symbol means.
Data Collection
Photo by Tahir Xəlfəquliyev on Pexels
Collecting data accurately is crucial for any geographical investigation. You need to choose appropriate methods and ensure your data is reliable.
- Primary Data: Data you collect yourself directly from the field.
- Observation: Simply watching and recording (e.g., traffic counts, land-use surveys).
- Measurement: Using instruments (e.g., measuring river depth/width, temperature, rainfall).
- Surveys/Questionnaires: Asking people questions to gather opinions or information.
- Sampling: You can't usually survey everything. Sampling means selecting a representative part of an area or population to study (e.g., systematic, random, stratified).
- Secondary Data: Data collected by someone else that you use for your study (e.g., census data, historical maps, online databases).
Data Presentation

Photo by Kampus Production on Pexels
Once you have your data, you need to present it clearly and effectively so others can understand your findings.
- Tables: Organise numerical data in rows and columns.
- Graphs:
- Bar charts: Compare quantities (discrete data).
- Line graphs: Show trends over time (continuous data).
- Pie charts: Show proportions of a whole.
- Scatter graphs: Show relationships between two variables.
- Maps:
- Choropleth maps: Use different colours/shades to show data intensity in areas (e.g., population density).
- Isoline maps: Connect points of equal value (e.g., isotherms for temperature).
- Flow maps: Show movement (e.g., migration, traffic flow).
- Diagrams: Simplified drawings to illustrate processes or structures (e.g., cross-sections of a valley).
Here’s a simplified flow for a typical geographical investigation:
graph TD
    A["Identify Research Question"] --> B["Plan Methodology (Data Type, Location, Tools)"]
    B --> C["Collect Primary/Secondary Data"]
    C --> D{"Process & Analyse Data"}
    D --> E["Present Findings (Maps, Graphs, Text)"]
    E --> F["Draw Conclusions & Evaluate"]
3. Worked Example
Let's say you're investigating how land use changes along a main road in your town.
- Map Interpretation: You start by looking at an Ordnance Survey map of the area. You use a six-figure grid reference to pinpoint a specific shop (e.g., 234567). You identify the scale (e.g., 1:25,000) to estimate distances between different land uses. You note the contour lines to see if the road has any steep sections that might influence business types.
- Data Collection: You conduct a land-use survey along a 2km stretch of the road. Every 50 metres (systematic sampling), you record the type of building/business (e.g., residential, retail, industrial, open space). You might also do a traffic count at a specific point to see vehicle types and numbers over 15 minutes.
- Data Presentation:
- You create a tally chart to record your land-use survey data.
- Then, you draw a bar chart to show the proportion of each land-use type along the road.
- You could also draw a simple sketch map of the road, marking different land uses with colours or symbols, and include your traffic count data in a table next to it.
- Finally, you write a short report describing your findings, referring back to your map interpretations and data presentations.
4. Key Takeaways
- Always check the map's scale and key before you start interpreting it.
- Grid references help you pinpoint exact locations; remember to read Eastings then Northings.
- Contour lines show elevation and slope – closer lines mean steeper slopes.
- Choose data collection methods (observation, measurement, surveys) that best answer your research question.
- Primary data is what you collect yourself; secondary data is from other sources.
- Use appropriate graphs (bar, line, pie, scatter) and maps (choropleth, isoline) to present different types of data effectively.
- Good presentation makes your geographical findings clear and understandable.
- Always be critical of your data – consider potential biases or inaccuracies.
5. Now Try It
Find a local map (online or physical, e.g., Google Maps satellite view).
1. Locate your school or a familiar landmark.
2. Identify at least three different land uses within a 1km radius (e.g., residential, retail, green space).
3. Estimate the distance between two of these land uses using the map's scale.
4. Describe the general topography (flat, hilly, steep) of the area using what you can infer from the map (e.g., if it's a topographical map, look at contour lines; if it's satellite, look at apparent changes in elevation).
What success looks like: You can identify different features, estimate distances, and describe the landscape's shape using map clues.
Frequently asked about Practical Geography Skills
Study this next
Get the full Geography p1 curriculum
Clone the complete plan to your dashboard for unlimited AI-generated notes, practice quizzes, and a personalised revision schedule.
Save this course free