Introduction to Scientific Measurement
From the Science curriculum
TL;DR
Scientific measurement is about getting reliable information using standard tools and units. Precision and accuracy are key to good measurements, and understanding significant figures helps you show how good your data is. Always record your data carefully and completely, including units.
1. The Mental Model
Think of scientific measurement like following a recipe perfectly. You need the right tools (measuring cups, scales), the right amounts (grams, milliliters), and you need to be careful to get the correct result. Just like a recipe, science needs exact measurements to work.
2. The Core Material
When you measure things in science, you're trying to get a quantitative description – a number with a unit. This is different from a qualitative description, which uses words (e.g., "hot," "cold").
All scientific measurements have two parts:
1. A number: This tells you the magnitude.
2. A unit: This tells you what you're measuring (e.g., meters, grams, seconds). Without a unit, a number is meaningless in science.
Accuracy vs. Precision
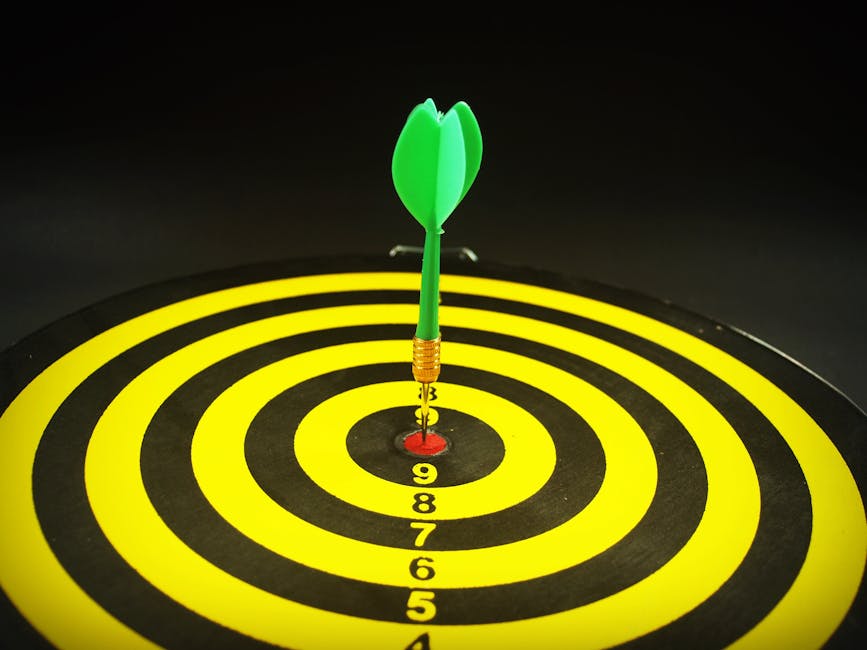
Photo by icon0 com on Pexels
These two terms are often confused, but they mean different things:
* Accuracy: How close your measurement is to the true or accepted value. Think of it as hitting the bullseye on a dartboard.
* Precision: How close multiple measurements are to each other. Think of it as consistently hitting the same spot on the dartboard, even if it's not the bullseye.
You want both accuracy and precision in your scientific measurements.
Significant Figures (Sig Figs)

Photo by Sümeyye Başbil on Pexels
Significant figures are the digits in a measurement that carry meaning and contribute to its precision. They tell you how much confidence you have in a measurement.
Here's how to determine significant figures:
1. Non-zero digits: Always significant (e.g., 45.87 has 4 sig figs).
2. Zeros between non-zero digits: Always significant (e.g., 2005 has 4 sig figs).
3. Leading zeros (before non-zero digits): Never significant (e.g., 0.0034 has 2 sig figs). They just show the decimal place.
4. Trailing zeros (at the end of the number):
* Significant if there's a decimal point (e.g., 5.00 has 3 sig figs).
* Not significant if there's no decimal point (e.g., 500 has 1 sig fig; 500. has 3 sig figs).
When you do calculations, the number of significant figures in your answer is limited by the least precise measurement used in the calculation.
Units of Measurement: The SI System

Photo by Castorly Stock on Pexels
Scientists around the world use the International System of Units (SI) to avoid confusion. It's based on seven base units:
graph LR
    A["SI Base Units"] --> B["Length: meter (m)"]
    A --> C["Mass: kilogram (kg)"]
    A --> D["Time: second (s)"]
    A --> E["Temperature: Kelvin (K)"]
    A --> F["Amount of Substance: mole (mol)"]
    A --> G["Electric Current: ampere (A)"]
    A --> H["Luminous Intensity: candela (cd)"]
You'll often use prefixes with these units to denote larger or smaller quantities (e.g., kilo-, milli-, micro-).
Recording Measurements
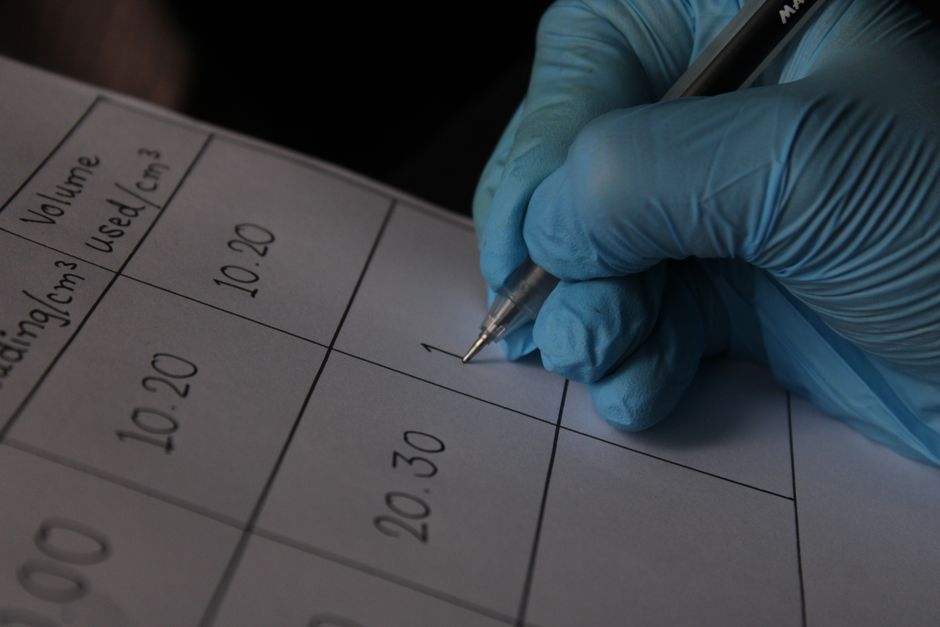
Photo by Jahra Tasfia Reza on Pexels
When you record a measurement, always:
* Include the number and the unit.
* Write down all the digits you know for sure, plus one estimated digit. This relates directly to significant figures. For example, if a ruler has marks every millimeter, you can estimate to the nearest tenth of a millimeter.
3. Worked Example
Let's say you're measuring the length of a pencil with a ruler marked in centimeters (cm) and millimeters (mm). The smallest mark is 1 mm (or 0.1 cm).
- Look at the ruler: You see the pencil ends somewhere past the 14 cm mark, and past the 14.3 cm mark.
- Record certain digits: You are certain the pencil is at least 14.3 cm long.
- Estimate one more digit: The pencil seems to end about halfway between 14.3 cm and 14.4 cm. You estimate it's 14.35 cm.
- Full measurement: 14.35 cm.
This measurement has four significant figures. If you had just written "14.3 cm," you'd be implying less precision, as the '5' is an important estimated digit. If you wrote "14.350 cm," you'd be implying more precision than your ruler allows.
4. Key Takeaways
- Every scientific measurement must include both a number and a unit.
- Accuracy is how close a measurement is to the true value; precision is how close multiple measurements are to each other.
- Significant figures communicate the precision of your measurement and should be respected in calculations.
- The SI system provides a universal set of units for scientific communication.
- Always record your measurements with the appropriate number of significant figures, including one estimated digit.
- Units are crucial;
10is not the same as10 meters. - Don't confuse precision with accuracy; you can be precise but inaccurate (consistently wrong).
- Don't use too many significant figures in your answer if your starting measurements aren't that precise.
5. Now Try It
Take a common household item (like a book or a phone) and a ruler (or measuring tape). Measure its length, width, and height. For each measurement, write down the value, the unit, and state how many significant figures are in your recorded measurement.
Success looks like: Three measurements, each with a number and a unit, and a correct count of significant figures for each. For example: "Length: 22.45 cm (4 significant figures)."
Frequently asked about Introduction to Scientific Measurement
Study this next
Get the full Science curriculum
Clone the complete plan to your dashboard for unlimited AI-generated notes, practice quizzes, and a personalised revision schedule.
Save this course free