Aquatic Fauna: Invertebrate Diversity and Indicator Species
From the aquatic ecology curriculum
TL;DR
Aquatic invertebrates are crucial to freshwater ecosystems and their diversity can tell us a lot about water quality. Certain species act as indicator species, signaling good or bad environmental conditions. Understanding these invertebrates helps us assess and monitor the health of aquatic habitats.
1. The Mental Model
Imagine a diverse community of tiny, spineless creatures living in a stream. Each species has specific needs, and some are very sensitive to pollution while others thrive in it. By looking at which species are present and in what numbers, you can "read" the stream's health report.
2. The Core Material
Aquatic invertebrates are animals without backbones that spend all or part of their lives in water. They include insects (like mayflies, caddisflies, dragonflies), crustaceans (like amphipods, crayfish), mollusks (snails, mussels), worms, and leeches. They play vital roles in aquatic food webs, breaking down organic matter and serving as food for fish and birds.
Why Diversity Matters

Photo by Mathias Reding on Pexels
Biodiversity refers to the variety of life in an ecosystem. In aquatic environments, high invertebrate diversity generally indicates a healthy, stable ecosystem with a good range of habitats and food sources. Conversely, low diversity, or the dominance of only a few species, can signal environmental stress.
Indicator Species
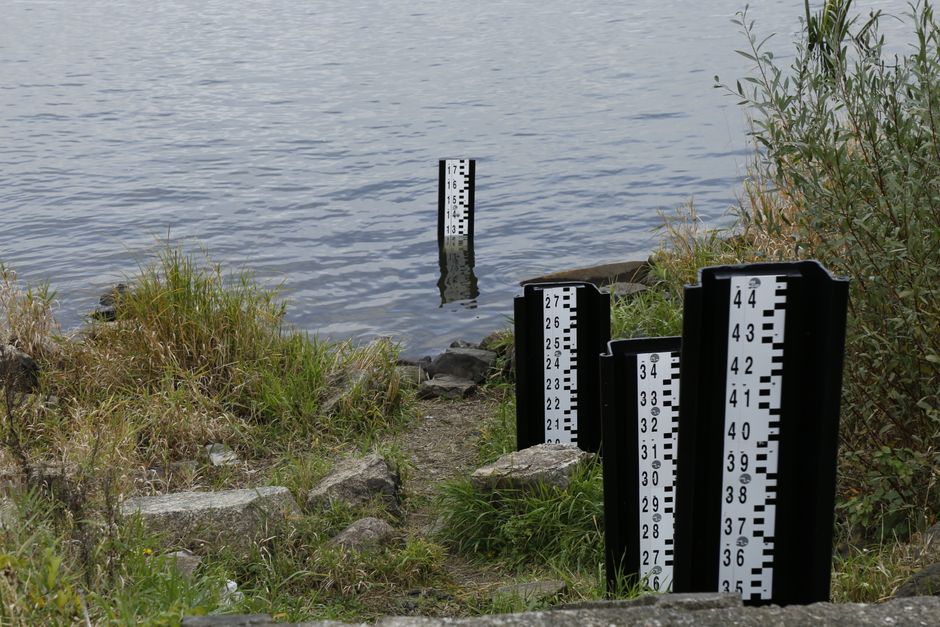
Photo by Robert Nowicki on Pexels
An indicator species is an organism whose presence, absence, or abundance reflects a specific environmental condition. For aquatic invertebrates, we often categorize them based on their tolerance to pollution, especially organic pollution (which reduces dissolved oxygen).
- Sensitive Species: These organisms require high levels of dissolved oxygen and clean water. Their presence indicates good water quality. Examples include many species of mayfly nymphs (Ephemeroptera), stonefly nymphs (Plecoptera), and caddisfly larvae (Trichoptera) – often abbreviated as EPT taxa.
- Moderately Tolerant Species: These can tolerate some pollution and lower oxygen levels. Examples include some species of scuds (amphipods), damselfly nymphs, and crayfish.
- Tolerant Species: These can survive in polluted, low-oxygen conditions. Their dominance or high abundance often indicates poor water quality. Examples include certain species of aquatic worms (Oligochaeta), midges (Chironomidae), and leeches (Hirudinea).
graph TD
    A["Aquatic Invertebrate Presence/Absence"] --> B{"Water Quality Assessment"};
    B --> C["High Diversity of EPT Taxa"];
    B --> D["Dominance of Tolerant Species (e.g., Worms, Midges)"];
    B --> E["Few Species, Low Overall Diversity"];

    C --> F["Good/Excellent Water Quality (High DO)"];
    D --> G["Poor Water Quality (Low DO, Pollution)"];
    E --> H["Stress in Ecosystem (Pollution, Habitat Loss)"];
Bioassessment Metrics

Photo by Luke Sutton on Pexels
Ecologists use various metrics to quantify water quality based on invertebrate communities:
- Taxa Richness: The total number of different species or taxonomic groups found. Higher richness generally means better quality.
- EPT Richness: The number of different mayfly, stonefly, and caddisfly taxa. A high EPT richness indicates clean water.
- Percent Tolerant Individuals: The proportion of individuals belonging to tolerant species. A high percentage suggests poor water quality.
- Biotic Indices: These combine the pollution tolerance values of different species with their abundance to produce a single score that reflects water quality.
3. Worked Example
Imagine you're sampling two streams, Stream A and Stream B, and you collect and identify the following aquatic invertebrates from standardized samples:
Stream A:
* Mayfly Nymphs (5 different species)
* Stonefly Nymphs (3 different species)
* Caddisfly Larvae (4 different species)
* Scuds (2 different species)
* Dragonfly Nymphs (1 species)
Stream B:
* Aquatic Worms (3 different species)
* Midge Larvae (7 different species)
* Leeches (2 different species)
* One species of Damselfly Nymph
Let's quickly analyze these:
Stream A Analysis:
* Taxa Richness: 5 + 3 + 4 + 2 + 1 = 15 different taxonomic groups.
* EPT Richness: 5 + 3 + 4 = 12 different EPT taxa.
* Interpretation: The presence of a high diversity of mayflies, stoneflies, and caddisflies strongly suggests Stream A has excellent water quality with high dissolved oxygen levels and minimal pollution.
Stream B Analysis:
* Taxa Richness: 3 + 7 + 2 + 1 = 13 different taxonomic groups. (Similar to Stream A, but the type of taxa differs greatly.)
* EPT Richness: 0 (No EPT taxa found).
* Interpretation: The dominance of aquatic worms, midge larvae, and leeches, and the complete absence of sensitive EPT taxa, indicates Stream B likely has poor water quality, probably with significant organic pollution and low dissolved oxygen. The presence of some damselflies (moderately tolerant) doesn't outweigh the overwhelming tolerant species.
4. Key Takeaways
- Aquatic invertebrates are essential to freshwater ecosystems, serving as food and detritivores.
- High invertebrate diversity generally indicates a healthy aquatic environment.
- Indicator species signal environmental conditions based on their pollution tolerance.
- Sensitive species (like EPT taxa) thrive in clean water, indicating good conditions.
- Tolerant species (like aquatic worms, midges) can dominate in polluted water, indicating poor conditions.
- Bioassessment uses metrics like taxa richness, EPT richness, and percent tolerant individuals to quantify water quality.
- The absence of sensitive species is as telling as the presence of tolerant species.
- You can assess water quality by looking at the types and numbers of invertebrates present.
5. Now Try It
Find a local stream, pond, or river (or a detailed case study online). Research the typical invertebrate species found in that type of habitat and list 3-5 species you would expect to find if the water quality were good, and 3-5 species you would expect to find if the water quality were poor. Based on the presence/absence of these indicator groups, how would you hypothesize about the water quality there?
Success looks like: A clear list of specific invertebrate types for "good" and "poor" conditions, showing you understand which are sensitive versus tolerant, and a brief, reasoned hypothesis about a real or imagined water body's health.
Frequently asked about Aquatic Fauna: Invertebrate Diversity and Indicator Species
More from aquatic ecology
Get the full aquatic ecology curriculum
Clone the complete plan to your dashboard for unlimited AI-generated notes, practice quizzes, and a personalised revision schedule.
Save this course free