Graphing Linear Equations and Functions
From the ALGBERA curriculum
Graphing Linear Equations and Functions
TL;DR
Graphing linear equations means drawing a straight line on a coordinate plane that represents all possible solutions to the equation. You'll usually do this by finding a few points that work for the equation and connecting them. Understanding slope and y-intercept is key to quickly graphing these lines.
1. The Mental Model
Think of a linear equation as a rule that tells you how two things are related. When you graph it, you're visually mapping out every pair of numbers that follows that rule, which always forms a straight line.
2. The Core Material
Graphing a linear equation means translating an algebraic rule (like y = 2x + 1) into a visual straight line on a coordinate plane. This line shows all the pairs of (x, y) values that make the equation true.
Standard Form and Slope-Intercept Form

Photo by Nataliya Vaitkevich on Pexels
Linear equations often show up in two main forms:
- Standard Form:
Ax + By = C(e.g.,3x + 2y = 6) - Slope-Intercept Form:
y = mx + b(e.g.,y = 2x + 1)
The slope-intercept form y = mx + b is super useful for graphing because:
* m is the slope, which tells you how steep the line is and its direction. It's often described as "rise over run" (change in y / change in x).
* b is the y-intercept, which is where the line crosses the y-axis (the vertical line). This is always a point (0, b).
Methods for Graphing

Photo by RDNE Stock project on Pexels
There are a few ways to graph a linear equation:
1. Plotting Points
This is the most straightforward method. You pick a few x values, plug them into the equation to find the corresponding y values, and then plot those (x, y) pairs. Two points are enough to define a line, but plotting three or more helps catch mistakes.
2. Using the Slope-Intercept Form (y = mx + b)
If your equation is in y = mx + b form:
1. Plot the y-intercept (b): This is your starting point, (0, b).
2. Use the slope (m): From the y-intercept, use the slope (rise over run) to find another point. For example, if m = 2 (or 2/1), you'd go up 2 units and right 1 unit. If m = -1/3, you'd go down 1 unit and right 3 units.
3. Draw the line: Connect the two points and extend the line with arrows to show it continues infinitely.
3. Using Intercepts (for Standard Form)
This method is good for equations in Ax + By = C form.
1. Find the y-intercept: Set x = 0 and solve for y. This gives you the point (0, y).
2. Find the x-intercept: Set y = 0 and solve for x. This gives you the point (x, 0).
3. Draw the line: Plot both intercepts and connect them.
Here's a diagram showing the common process for graphing linear equations:
graph TD
    A["Start with a Linear Equation"] --> B{"Is it in y = mx + b form?"}
    B -- "Yes" --> C["Identify y-intercept (b)"]
    C --> D["Plot (0, b)"]
    D --> E["Identify slope (m = rise/run)"]
    E --> F["From (0, b), use slope to find a 2nd point"]
    F --> G["Draw a straight line through the points"]
    B -- "No" --> H{"Can you convert to y = mx + b?"}
    H -- "Yes" --> I["Solve for y to get y = mx + b"]
    I --> C
    H -- "No (e.g., Ax + By = C)" --> J["Find x-intercept (set y=0, solve for x)"]
    J --> K["Find y-intercept (set x=0, solve for y)"]
    K --> G
    G --> L["End: Graph is complete"]
Functions vs. Equations
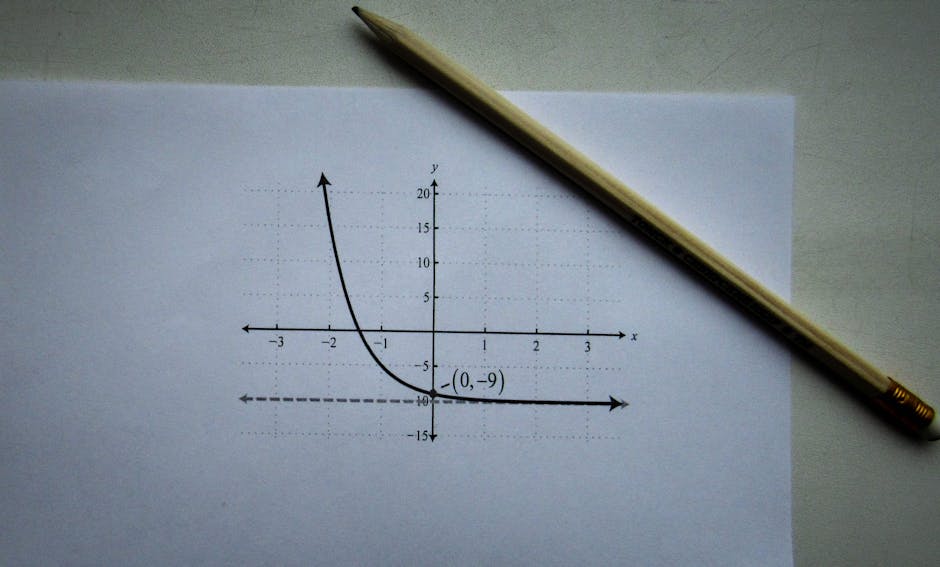
Photo by Sergey Meshkov on Pexels
A linear equation like y = 2x + 1 describes a relationship. A linear function usually uses function notation like f(x) = 2x + 1. Graphically, they look identical. The main difference is how we talk about them: a function emphasizes that for every x input, there's exactly one y output.
3. Worked Example
Let's graph the linear equation 3x - y = 6.
-
Convert to slope-intercept form (
y = mx + b):
3x - y = 6
Subtract3xfrom both sides:
-y = -3x + 6
Multiply both sides by-1:
y = 3x - 6 -
Identify the y-intercept (
b):
Fromy = 3x - 6,b = -6. So, the y-intercept is(0, -6). -
Identify the slope (
m):
Fromy = 3x - 6,m = 3. As a fraction, this is3/1(rise = 3, run = 1). -
Plot the y-intercept:
Place a point at(0, -6)on your coordinate plane. -
Use the slope to find another point:
From(0, -6), move up 3 units (rise) and right 1 unit (run). This brings you to the point(1, -3). -
Draw the line:
Connect the points(0, -6)and(1, -3)with a straight line, extending it in both directions and adding arrows. This line represents all solutions to3x - y = 6.
4. Key Takeaways
- A linear equation always graphs as a straight line.
- The slope (
m) iny = mx + btells you the line's steepness and direction ("rise over run"). - The y-intercept (
b) iny = mx + bis the point(0, b)where the line crosses the y-axis. - You only need two distinct points to draw a straight line, but a third point can help verify accuracy.
- To graph using intercepts, set
x=0to find the y-intercept andy=0to find the x-intercept.
Common Mistakes to Avoid:
* Mixing up rise and run: Always remember m = rise/run (change in y / change in x).
* Incorrectly converting to y = mx + b: Be careful with signs when moving terms across the equals sign.
* Plotting points incorrectly: Double-check your x and y coordinates.
* Forgetting negative signs for slope: A negative slope means the line goes downwards from left to right.
5. Now Try It
Graph the equation 2x + 4y = 8 using the slope-intercept method. What are the slope and y-intercept? Plot at least three points including the y-intercept, and draw your line. Success looks like accurately identifying the slope and y-intercept and drawing a straight line that passes through (0, 2), (2, 1), and (4, 0).
Frequently asked about Graphing Linear Equations and Functions
Study this next
Get the full ALGBERA curriculum
Clone the complete plan to your dashboard for unlimited AI-generated notes, practice quizzes, and a personalised revision schedule.
Create Free Account