Analyzing and Graphing Linear Equations
From the Algebra 1 curriculum
Analyzing and Graphing Linear Equations
TL;DR
Linear equations describe straight lines on a graph, and you can understand a line's behavior by looking at its slope and y-intercept. You'll learn to easily graph these lines and solve real-world problems using their properties.
1. The Mental Model
Think of linear equations like instructions for drawing a straight path. The equation tells you where the path starts (y-intercept) and how steep it is (slope), so you can accurately draw it every time.
2. The Core Material
Linear equations are super important in algebra because they represent a constant rate of change. They usually look like $y = mx + b$.
- y is the output value, often plotted on the vertical axis.
- x is the input value, often plotted on the horizontal axis.
- m is the slope. This tells you the steepness and direction of the line. It's often described as "rise over run."
- b is the y-intercept. This is the point where the line crosses the y-axis. It's the value of y when x is 0.
Understanding Slope (m)

Photo by Sergio Zhukov on Pexels
Slope is how much 'y' changes for every 1 unit change in 'x'.
* A positive slope means the line goes up from left to right.
* A negative slope means the line goes down from left to right.
* A slope of zero means the line is horizontal (flat).
* An undefined slope means the line is vertical.
You can calculate slope using two points, $(x_1, y_1)$ and $(x_2, y_2)$, with the formula: $m = \frac{y_2 - y_1}{x_2 - x_1}$.
Understanding Y-intercept (b)

Photo by Sami Abdullah on Pexels
The y-intercept is where the line "intercepts" or crosses the vertical y-axis. It's always a point with an x-coordinate of 0, so it's written as $(0, b)$. It's your starting point on the y-axis when you graph.
Graphing from $y = mx + b$ (Slope-Intercept Form)
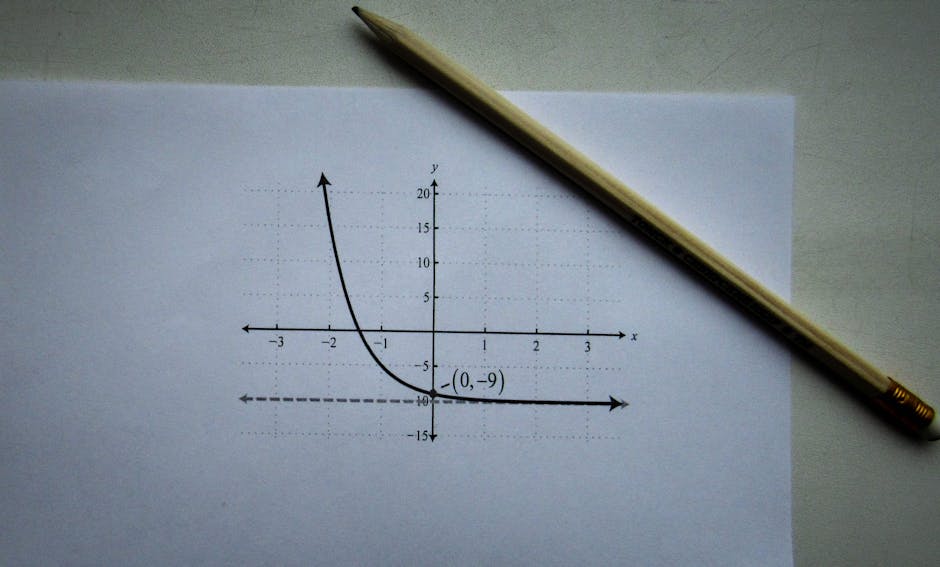
Photo by Sergey Meshkov on Pexels
This is the easiest way to graph a line:
1. Plot the y-intercept (b): Put a dot on the y-axis at the value of 'b'.
2. Use the slope (m) to find another point:
* If $m = \frac{\text{rise}}{\text{run}}$, move 'rise' units up or down (depending on its sign) from your y-intercept.
* Then, move 'run' units to the right (if positive) or left (if negative).
* Place a second dot.
3. Draw the line: Connect the two dots and extend the line with arrows on both ends.
graph TD
    A["Start: Get Equation (y = mx + b)"] --> B{"Is it in y = mx + b form?"};
    B -- No --> C["Rearrange to isolate y"];
    B -- Yes --> D["Identify 'b' (y-intercept)"];
    D --> E["Plot point (0, b) on y-axis"];
    E --> F["Identify 'm' (slope = rise/run)"];
    F --> G["From (0, b), count 'rise' up/down"];
    G --> H["From that point, count 'run' right/left"];
    H --> I["Plot second point"];
    I --> J["Draw a straight line connecting the two points"];
    J --> K["Extend line with arrows"];
    K --> L["End: Line graphed"];
3. Worked Example
Let's graph the equation $y = 2x - 3$.
- Identify 'b': The y-intercept is $-3$. So, the first point to plot is $(0, -3)$.
- Identify 'm': The slope is $2$. As a fraction, that's $\frac{2}{1}$.
- This means a "rise" of 2 and a "run" of 1.
- Plot the y-intercept: Put a dot on the y-axis at $-3$.
- Use the slope: From $(0, -3)$:
- Move up 2 units (rise). You're now at y-coordinate $-1$.
- Move right 1 unit (run). You're now at x-coordinate $1$.
- This gives you a second point: $(1, -1)$.
- Draw the line: Connect $(0, -3)$ and $(1, -1)$ and extend the line.
4. Key Takeaways
- Linear equations represent straight lines on a graph.
- The slope (
m) tells you the line's steepness and direction (rise over run). - The y-intercept (
b) is where the line crosses the y-axis, located at $(0, b)$. - $y = mx + b$ is called slope-intercept form and is super useful for graphing.
- A positive slope means the line goes up to the right; a negative slope means it goes down to the right.
Common Mistakes to Avoid:
- Mixing up 'x' and 'y' coordinates when plotting points.
- Confusing the rise and run when applying the slope.
- Forgetting that the y-intercept is always $(0, b)$, not $(b, 0)$.
- Not simplifying fractions for slope before using them for rise/run.
5. Now Try It
Graph the equation $y = -\frac{1}{2}x + 4$ on a piece of graph paper.
What success looks like: You'll have a straight line that crosses the y-axis at $(0, 4)$ and goes down one unit and right two units from any point on the line.
Frequently asked about Analyzing and Graphing Linear Equations
Study this next
Get the full Algebra 1 curriculum
Clone the complete plan to your dashboard for unlimited AI-generated notes, practice quizzes, and a personalised revision schedule.
Create Free Account