Introduction to Data Science and Probability
From the https://youtube.com/playlist?list=PL5b9mn6-ELrGLIGLIKJciEZI9sypPk2a0&si=hlFbxZOUNGfYPrWL curriculum
Introduction to Data Science and Probability
TL;DR
Data science is about using data to understand the world and make predictions, while probability is the math that helps us quantify uncertainty. You'll learn how to approach problems by defining them, collecting data, analyzing it, and communicating insights. Understanding basic probability helps you interpret your findings and build more reliable models.
1. The Mental Model
Imagine you're a detective. Data science is your toolkit for finding clues (data), piecing together the story (analysis), and telling others what you've discovered. Probability is your way of saying how sure you are about your conclusions, acknowledging that there's always some uncertainty.
2. The Core Material
What is Data Science?
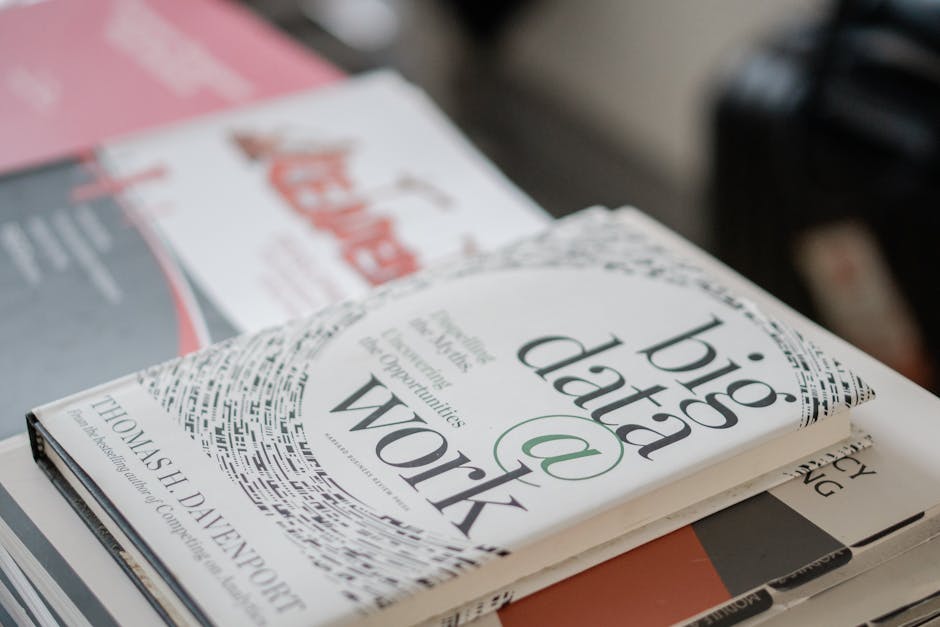
Photo by Asad Photo Maldives on Pexels
Data science is an interdisciplinary field that uses scientific methods, processes, algorithms, and systems to extract knowledge and insights from structured and unstructured data. It's not just about crunching numbers; it's about asking good questions, finding the right data, cleaning it up, exploring it, building models, and then explaining what you found to others in a clear way.
The typical data science workflow can be broken down into several stages:
graph TD
    A["Define Problem/Question (What are we trying to solve?)"] --> B["Collect Data (Where can we find relevant info?)"]
    B --> C["Clean & Prepare Data (Is the data ready to use?)"]
    C --> D["Explore & Visualize Data (What patterns do we see?)"]
    D --> E["Model Data (Can we predict or explain something?)"]
    E --> F["Evaluate Model (How well does it work?)"]
    F --> G["Communicate Results (What did we learn and why does it matter?)"]
    G --> A;
What is Probability?

Photo by DS stories on Pexels
Probability is the branch of mathematics concerning numerical descriptions of how likely an event is to occur, or how likely it is that a proposition is true. It's expressed as a number between 0 and 1, where 0 means the event is impossible and 1 means it's certain. For example, if you flip a fair coin, the probability of getting heads is 0.5 (or 50%).
Key concepts in probability include:
* Experiment: An action or process that leads to one of several possible outcomes (e.g., flipping a coin, rolling a die).
* Outcome: A single result of an experiment (e.g., heads, rolling a 3).
* Event: One or more outcomes of an experiment (e.g., getting an even number when rolling a die).
* Sample Space: The set of all possible outcomes of an experiment.
Why do Data Science and Probability go together?
Photo by DS stories on Pexels
Probability is the theoretical foundation for many data science techniques. When you build a predictive model, you're often estimating the probability of an event happening. When you interpret survey results, probability helps you understand how likely it is that your sample accurately represents the larger population. It helps you quantify the uncertainty inherent in data and models.
For example, when you say "there's an 80% chance this customer will churn next month," you're using probability. Or, when you test if a new website design performs better than an old one, you're using statistical tests rooted in probability to decide if the difference you observe is likely real or just random chance.
3. Worked Example
Let's say you're a data scientist for an online store, and you want to understand if a new "Recommended Products" algorithm actually increases purchases.
- Define Problem: Does the new algorithm lead to a higher probability of a user adding a recommended product to their cart?
- Collect Data: You randomly split users into two groups: Group A (control) sees the old algorithm, Group B (test) sees the new one. You track how many users in each group add a recommended product to their cart over a week.
- Group A: 1000 users, 50 added a recommended product.
- Group B: 1000 users, 70 added a recommended product.
- Calculate Probabilities:
- Probability of adding product (Group A) = 50 / 1000 = 0.05 (or 5%)
- Probability of adding product (Group B) = 70 / 1000 = 0.07 (or 7%)
- Initial Insight: It looks like Group B (new algorithm) has a higher probability of adding a recommended product.
- What's next? A data scientist wouldn't stop here. They'd use statistical tests (which are built on probability theory) to determine if this 2% difference is statistically significant, meaning it's unlikely to have happened by random chance. If it is, then you can confidently say the new algorithm is better. If not, the difference might just be noise.
4. Key Takeaways
- Data science is a systematic approach to extracting insights and knowledge from data.
- The data science workflow typically involves problem definition, data collection, cleaning, exploration, modeling, evaluation, and communication.
- Probability quantifies the likelihood of events, expressed as a number between 0 (impossible) and 1 (certain).
- Probability provides the mathematical foundation for understanding uncertainty in data and validating data science models.
- A strong understanding of both fields helps you make data-driven decisions with confidence.
Common mistakes to avoid:
- Jumping straight to modeling without understanding or cleaning your data first.
- Ignoring the "why" behind a problem and just crunching numbers.
- Confusing correlation with causation; just because two things happen together doesn't mean one causes the other.
- Not accounting for uncertainty or expressing results as absolute facts when they're probabilistic.
- Presenting complex technical jargon instead of clear, actionable insights.
5. Now Try It
Think about a simple decision you recently made (e.g., choosing what to wear, which route to take, what to eat). Spend 15 minutes trying to break down how you made that decision using a simplified data science workflow.
- Problem/Question: What was the decision you needed to make?
- Data Collection: What information (data) did you use to make that decision? (e.g., weather forecast, traffic reports, how hungry you were).
- Analysis/Thought Process: How did you process that information? Did you weigh certain factors more heavily? (This is your "model").
- Outcome/Result: What was the result of your decision?
- Probability (Optional): Could you assign a "likelihood" to certain outcomes before you made the decision?
Success looks like: You can clearly articulate the steps you took, even if informally, and recognize that you inherently use "data" and "probability" in everyday thinking.
Frequently asked about Introduction to Data Science and Probability
Study this next
Get the full https://youtube.com/playlist?list=PL5b9mn6-ELrGLIGLIKJciEZI9sypPk2a0&si=hlFbxZOUNGfYPrWL curriculum
Clone the complete plan to your dashboard for unlimited AI-generated notes, practice quizzes, and a personalised revision schedule.
Create Free Account