Foundations of Coordinate Systems and Graphs
From the applied mathematics curriculum
Foundations of Coordinate Systems and Graphs
TL;DR
Coordinate systems provide a structured way to describe locations in space using numbers. Graphs visually represent relationships between these numbers, making complex data easier to understand. Mastering these foundations is crucial for visualizing functions, solving geometry problems, and interpreting data in applied mathematics.
1. The Mental Model
Think of a coordinate system as a grid you use to pinpoint exact locations, like streets and avenues on a city map. A graph is then the drawing you make on that grid to show how different locations or values are connected.
2. The Core Material
You'll mostly work with the Cartesian coordinate system, which is the most common one. It uses perpendicular number lines (axes) to define points.
The Number Line

Photo by KoolShooters on Pexels
First, let's revisit the number line. It's a straight line where every point corresponds to a real number. You have an origin (usually 0) and positive numbers going one way, negative numbers the other. This is a 1-dimensional system.
The Cartesian Plane (2D)

Photo by Sergey Meshkov on Pexels
To locate points in a 2-dimensional space (like a piece of paper), you need two number lines. These are called the x-axis (horizontal) and the y-axis (vertical). They intersect at a point called the origin, which has coordinates (0, 0).
- x-coordinate (abscissa): Tells you how far left or right a point is from the origin. Positive values are to the right, negative to the left.
- y-coordinate (ordinate): Tells you how far up or down a point is from the origin. Positive values are up, negative down.
A point is always written as (x, y). The order matters! (2, 3) is different from (3, 2).
Quadrants
The x-axis and y-axis divide the plane into four regions called quadrants, typically numbered with Roman numerals counter-clockwise starting from the top right:
- Quadrant I: x > 0, y > 0 (e.g., (2, 5))
- Quadrant II: x < 0, y > 0 (e.g., (-3, 1))
- Quadrant III: x < 0, y < 0 (e.g., (-4, -2))
- Quadrant IV: x > 0, y < 0 (e.g., (6, -7))
Points lying directly on an axis (where x=0 or y=0) are not in any quadrant.
Plotting Points
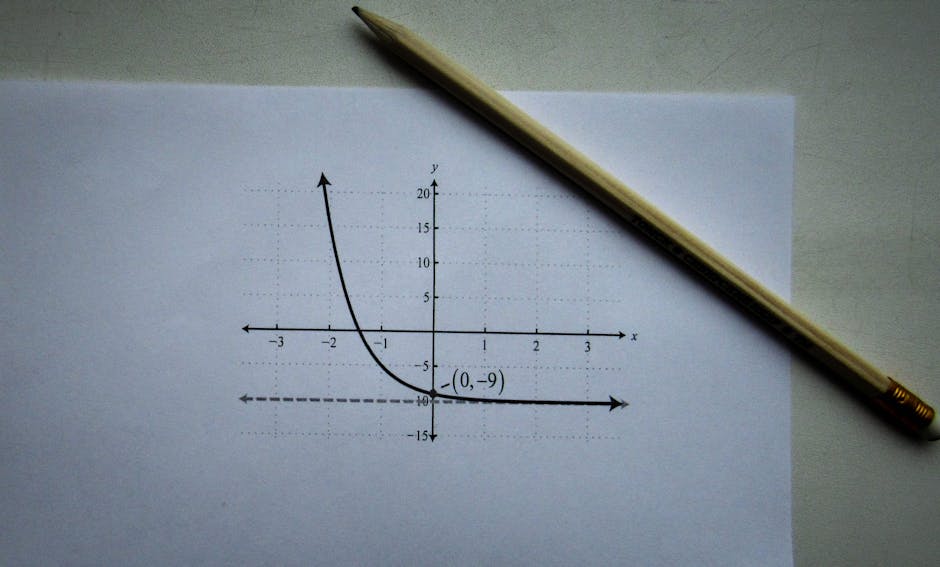
Photo by Sergey Meshkov on Pexels
To plot a point (x, y):
1. Start at the origin (0, 0).
2. Move x units horizontally (right if positive, left if negative).
3. From there, move y units vertically (up if positive, down if negative).
4. Mark the spot.
Graphs of Equations
Photo by Sergey Meshkov on Pexels
A graph is a visual representation of all the points (x, y) that satisfy a given equation. For example, y = 2x + 1. If you pick an x value, calculate y, and plot that point, then repeat for many x values, you'll see a pattern.
Consider the process of creating a graph from an equation:
graph TD
    A["Start with an Equation (e.g., y = 2x - 1)"] --> B["Choose x-values (e.g., -2, -1, 0, 1, 2)"]
    B --> C{"Calculate corresponding y-values?"}
    C --> D["Form (x, y) Coordinate Pairs"]
    D --> E["Plot Points on Cartesian Plane"]
    E --> F["Connect Points to Form Graph"]
    F --> G["Observe Shape / Trends of Graph"]
Distance Formula
To find the distance between two points (x1, y1) and (x2, y2):
d = √((x2 - x1)² + (y2 - y1)²)
This comes directly from the Pythagorean theorem: the distance is the hypotenuse of a right triangle formed by the change in x and change in y.
Midpoint Formula
To find the midpoint (xm, ym) of a line segment connecting (x1, y1) and (x2, y2):
xm = (x1 + x2) / 2
ym = (y1 + y2) / 2
You're essentially finding the average of the x-coordinates and the average of the y-coordinates.
3. Worked Example
Let's find the distance and midpoint between two points, P1 = (-3, 4) and P2 = (5, -2).
-
Identify coordinates:
x1 = -3,y1 = 4
x2 = 5,y2 = -2 -
Calculate the distance:
d = √((x2 - x1)² + (y2 - y1)²)
d = √((5 - (-3))² + (-2 - 4)²)
d = √((5 + 3)² + (-6)²)
d = √((8)² + (-6)²)
d = √(64 + 36)
d = √(100)
d = 10The distance between
(-3, 4)and(5, -2)is 10 units. -
Calculate the midpoint:
xm = (x1 + x2) / 2
xm = (-3 + 5) / 2
xm = 2 / 2
xm = 1ym = (y1 + y2) / 2
ym = (4 + (-2)) / 2
ym = (4 - 2) / 2
ym = 2 / 2
ym = 1The midpoint is
(1, 1).
4. Key Takeaways
- Coordinate systems provide a standardized way to describe locations using ordered numbers.
- The Cartesian plane uses an x-axis and a y-axis intersecting at the origin (0,0) to define 2D points (x, y).
- Quadrants divide the plane based on the signs of the x and y coordinates.
- Graphs are visual representations of equations or relationships between variables.
- The distance formula
d = √((x2 - x1)² + (y2 - y1)²)calculates the length between two points. - The midpoint formula
((x1 + x2)/2, (y1 + y2)/2)finds the center point of a line segment.
Common Mistakes to Avoid
- Swapping x and y coordinates when plotting or using formulas; remember (x, y).
- Incorrectly applying negative signs, especially when subtracting negative numbers in formulas.
- Forgetting to square the differences before adding them in the distance formula.
- Not simplifying square roots when possible in the distance formula.
5. Now Try It
Plot the points A=(-4, -1), B=(2, 7), and C=(2, -1) on graph paper. Then, calculate the distance between points A and B, and find the midpoint of the line segment BC. What success looks like: You'll have three clearly marked points, a distance calculation of 10 units for A to B, and a midpoint for B to C at (2, 3).
Frequently asked about Foundations of Coordinate Systems and Graphs
Study this next
Get the full applied mathematics curriculum
Clone the complete plan to your dashboard for unlimited AI-generated notes, practice quizzes, and a personalised revision schedule.
Create Free Account