Functions and Graphs
From the Math curriculum
Functions and Graphs
TL;DR
Functions are rules that turn an input into exactly one output, like a vending machine. Graphs are visual maps of these rules, showing how inputs relate to outputs. Understanding them helps you describe and predict changes in many real-world situations.
1. The Mental Model
Think of a function as a well-behaved machine: you put something in (the input), and it consistently gives you one specific thing out (the output). A graph is like drawing a picture of what happens inside that machine for all possible inputs.
2. The Core Material
Functions are central to math. A function assigns each input value (from the domain) to exactly one output value (in the range). This "exactly one output" rule is crucial. If an input gives more than one output, it's not a function.
How to Write Functions

Photo by Ann H on Pexels
You often see functions written as f(x) = ....
* f is the name of the function (you could use g, h, etc.).
* x is the input variable.
* f(x) represents the output of the function when the input is x. It's not f times x!
Example: If f(x) = 2x + 1, this function takes an input x, multiplies it by 2, and then adds 1.
* If x = 3, then f(3) = 2(3) + 1 = 6 + 1 = 7.
* If x = -1, then f(-1) = 2(-1) + 1 = -2 + 1 = -1.
Domain and Range
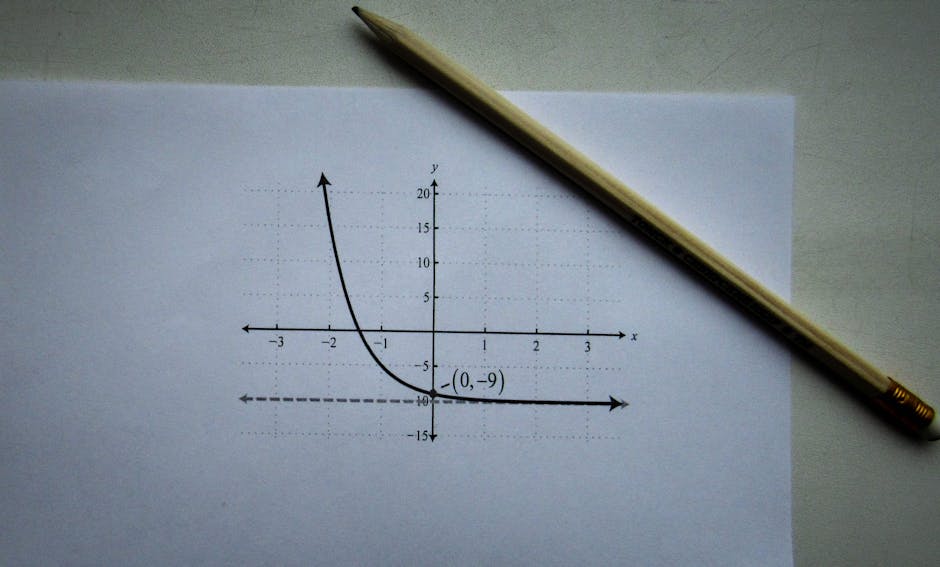
Photo by Sergey Meshkov on Pexels
- The domain is the set of all possible input values for a function.
- The range is the set of all possible output values that the function can produce.
For f(x) = 2x + 1, you can input any real number, so the domain is all real numbers. The outputs can also be any real number, so the range is all real numbers.
However, for g(x) = 1/x, you can't divide by zero, so x cannot be 0. The domain is all real numbers except 0. The range is also all real numbers except 0.
Graphing Functions
Photo by Sergey Meshkov on Pexels
A graph helps you see the relationship between inputs and outputs. We usually plot inputs (x values) on the horizontal axis and outputs (y or f(x) values) on the vertical axis. Each point on the graph is (input, output).
To graph f(x) = 2x + 1:
1. Pick some x values.
2. Calculate the f(x) (or y) values.
3. Plot the points (x, f(x)).
4. Connect them with a line or curve.
| x | f(x) = 2x + 1 | Point (x, y) |
|---|---|---|
| -2 | -3 | (-2, -3) |
| 0 | 1 | (0, 1) |
| 1 | 3 | (1, 3) |
Plotting these points and drawing a straight line through them gives you the graph of f(x) = 2x + 1.
Types of Functions (and their common graphs)
Photo by Sergey Meshkov on Pexels
There are many types, but here are some common ones:
- Linear functions:
f(x) = mx + b(straight lines).mis the slope,bis the y-intercept. - Quadratic functions:
f(x) = ax² + bx + c(parabolas, U-shaped curves). - Polynomial functions:
f(x) = ax^n + ... + c(smooth, continuous curves, can have multiple "wiggles"). - Rational functions:
f(x) = P(x)/Q(x)where P and Q are polynomials (can have breaks or asymptotes – lines the graph approaches but never touches). - Exponential functions:
f(x) = a^x(grow or shrink very quickly). - Logarithmic functions:
f(x) = log_b(x)(inverse of exponential, grow slowly).
The Vertical Line Test
This is a quick way to check if a graph represents a function. If any vertical line you draw crosses the graph at more than one point, then it's not a function. This is because a single input (x value) would lead to multiple outputs (y values).
graph TD
    Start["Does each input have (only) ONE output?"] --> IsFunction{Is it a function?};
    IsFunction -- "Yes" --> Graphable["Plot points (x, f(x))"];
    Graphable --> IsGraphFunction{Does a vertical line cross the graph at only ONE point?};
    IsGraphFunction -- "Yes" --> FunctionConfirmed["It's a function!"];
    IsGraphFunction -- "No" --> NotFunctionGraph["Not a function (failed VLT)"];
    IsFunction -- "No" --> NotFunction["It's not a function."];
3. Worked Example
Let's work with the function g(x) = x² - 4.
Step 1: Find the domain.
Can you square any real number? Yes. Can you subtract 4 from any real number? Yes. So, the domain is all real numbers.
Step 2: Calculate some points for graphing.
Let's pick a few x values:
x = -3:g(-3) = (-3)² - 4 = 9 - 4 = 5. Point:(-3, 5)x = -2:g(-2) = (-2)² - 4 = 4 - 4 = 0. Point:(-2, 0)x = 0:g(0) = (0)² - 4 = 0 - 4 = -4. Point:(0, -4)x = 2:g(2) = (2)² - 4 = 4 - 4 = 0. Point:(2, 0)x = 3:g(3) = (3)² - 4 = 9 - 4 = 5. Point:(3, 5)
Step 3: Sketch the graph.
Plot these points on a coordinate plane. You'll see a U-shaped curve, which is typical for a quadratic function. The lowest point of this curve is at (0, -4).
Step 4: Determine the range.
Looking at the graph, the lowest y value is -4, and the graph extends upwards indefinitely. So, the range is all real numbers greater than or equal to -4. (Written as y ≥ -4 or [-4, ∞)).
Step 5: Apply the Vertical Line Test.
Imagine drawing vertical lines across your graph. Does any vertical line hit the curve more than once? No. So, g(x) = x² - 4 is indeed a function.
4. Key Takeaways
- A function takes an input and produces exactly one output.
f(x)means "the output of functionfwhen the input isx."- The domain is all possible inputs; the range is all possible outputs.
- Graphs visually show the relationship between inputs (x-axis) and outputs (y-axis).
- The Vertical Line Test quickly checks if a graph represents a function.
- Common function types (linear, quadratic, exponential) have recognizable graph shapes.
- Plotting points helps you sketch a function's graph.
Common Mistakes to Avoid:
- Confusing
f(x)withfmultiplied byx. - Assuming every equation represents a function (remember the single output rule!).
- Forgetting that you can't divide by zero or take the square root of a negative number when determining the domain.
- Mixing up the x and y axes when plotting points or reading a graph.
5. Now Try It
Given the function h(x) = -x + 3:
1. Determine the domain and range of h(x).
2. Calculate h(-1), h(0), and h(4).
3. Plot these three points on a coordinate plane and draw the graph of h(x).
4. Use the Vertical Line Test on your graph to confirm it's a function.
Success looks like you correctly finding the input-output pairs, drawing a straight line through them, and stating the correct domain and range (which will both be all real numbers for this linear function).
Frequently asked about Functions and Graphs
More from Math
Get the full Math curriculum
Clone the complete plan to your dashboard for unlimited AI-generated notes, practice quizzes, and a personalised revision schedule.
Create Free Account