Volcano Monitoring and Prediction Techniques
From the Volcanoes geog curriculum
Volcano Monitoring and Prediction Techniques
TL;DR
You'll learn how scientists keep an eye on volcanoes using various tools to detect subtle changes. By understanding these signals, we can forecast eruptions and give communities crucial warning. This helps save lives and reduces damage from volcanic activity.
1. The Mental Model
Think of monitoring a volcano like a doctor checking a patient's vital signs. You're looking for any changes in its "health" – swelling, temperature spikes, or unusual noises – that might indicate something serious is about to happen.
2. The Core Material
Volcano monitoring isn't about predicting the exact minute of an eruption, but rather identifying increasing probabilities and timelines. It's a multi-faceted approach, using different sensors to pick up various signals.
a. Seismic Monitoring (Earthquakes)
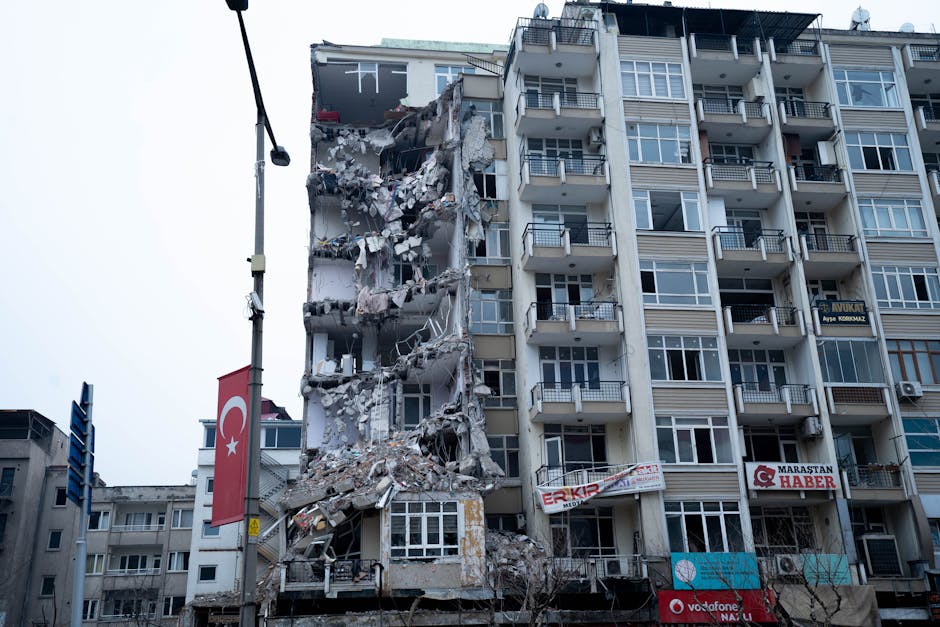
Photo by Ömer Furkan Yakar on Pexels
Before an eruption, magma moving underground often cracks rocks, causing small earthquakes. Seismometers detect these tremors, and scientists look at their frequency, depth, and intensity. An increase in shallow earthquakes often signals magma rising closer to the surface.
b. Ground Deformation (Swelling)
Photo by Alex Dos Santos on Pexels
As magma accumulates or moves, the ground above it can swell, tilt, or spread apart.
* Tiltmeters measure very small changes in the ground's slope.
* GPS (Global Positioning System) stations track horizontal and vertical movement of points on the volcano.
* InSAR (Interferometric Synthetic Aperture Radar) uses satellite radar images to create maps showing ground uplift or subsidence over large areas, even tiny changes of a few centimeters.
c. Gas Emissions
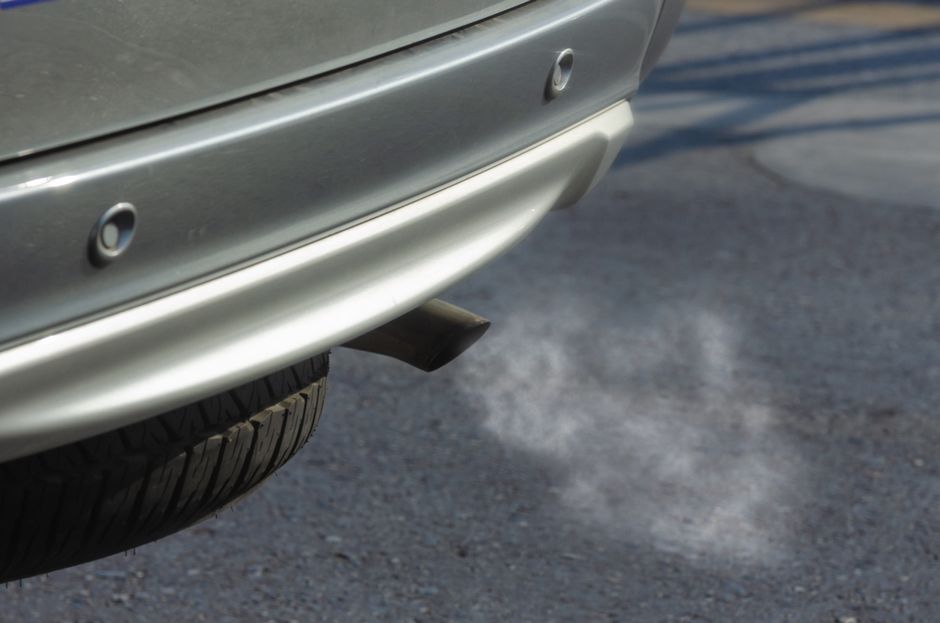
Photo by Khunkorn Laowisit on Pexels
Magma releases gases (like sulfur dioxide, carbon dioxide, and hydrogen sulfide) as it approaches the surface. Changes in the type, quantity, or ratio of these gases can indicate new magma input or an increased likelihood of eruption. Scientists use spectrometers, gas sniffers, and even drones to collect these samples.
d. Thermal Monitoring
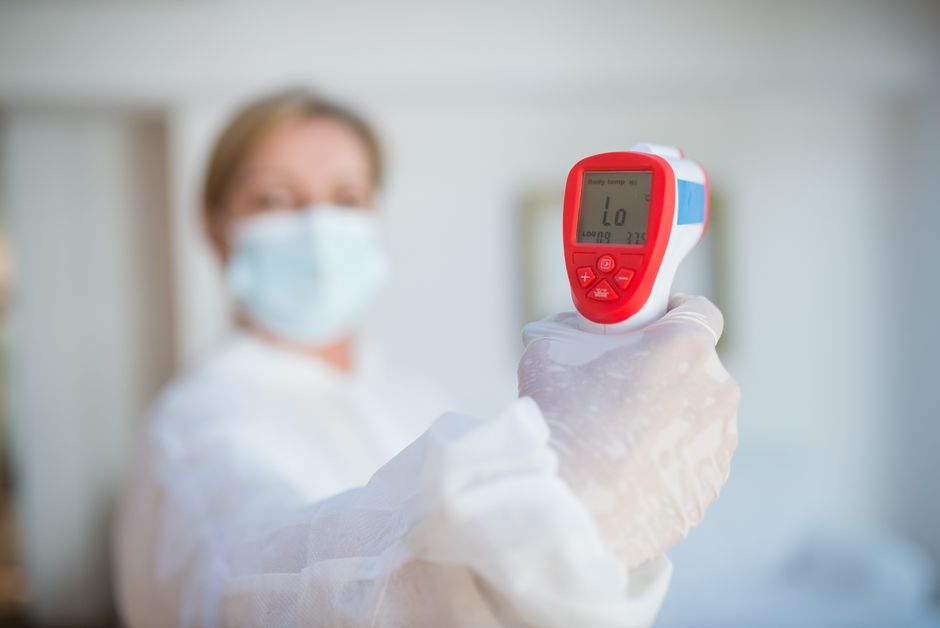
Photo by Kampus Production on Pexels
Rising magma heats the ground and can increase the temperature of fumaroles (steam vents) or hot springs. Infrared cameras (ground-based or satellite) can detect these temperature anomalies on the volcano's surface, indicating increased heat flow.
e. Hydrology
Volcanoes can affect water systems. Changes in the temperature, acidity, or chemical composition of crater lakes, hot springs, or streams on the volcano's flanks can signal increased volcanic activity or gas release.
Here's a simplified view of the monitoring process:
graph TD
    A["Volcano Activity (Baseline)"] --> B{"Sensors Deployd"};
    B --> C["Seismometers (Earthquakes)"];
    B --> D["GPS/Tiltmeters/InSAR (Ground Movement)"];
    B --> E["Gas Spectrometers (Gas Emissions)"];
    B --> F["Thermal Cameras (Heat Changes)"];
    C --> G{"Data Collection & Analysis"};
    D --> G;
    E --> G;
    F --> G;
    G --> H{"Pattern Recognition (e.g., increased quakes, ground uplift, gas flux)"};
    H -- "Significant Change Detected" --> I["Alert Level Raised"];
    H -- "No Significant Change" --> J["Continue Monitoring"];
    I --> K["Public Warning & Evacuation Plans"];
    I --> L["Further Intensive Monitoring"];
    L --> K;
3. Worked Example
Imagine you're monitoring Mount Ruapehu in New Zealand. For weeks, seismic activity has been low, ground deformation stable, and gas emissions consistent. Suddenly, over 24 hours, you observe:
- Seismic: A shift from 5-10 small, deep earthquakes per day to 50+ shallow earthquakes (less than 3 km deep) per day, with some tremor bursts.
- Ground Deformation: GPS stations near the summit show a 2 cm uplift over the past week, accelerating to 0.5 cm in the last 12 hours. Tiltmeters also show a slight inflation.
- Gas Emissions: COSPEC measurements (for sulfur dioxide) show an increase from 50 tonnes/day to 500 tonnes/day, and gas sniffers detect higher levels of CO2 and H2S in fumarole areas.
- Thermal: Satellite imagery from Sentinel-2 shows new, slightly warmer areas around the crater lake, and direct measurements show a 5°C rise in the lake's temperature.
Combining these signals, you'd elevate the alert level. The increased shallow seismicity suggests magma ascent, the ground uplift confirms magma accumulation, the higher gas flux points to magma degassing, and thermal changes show heat reaching the surface. This multi-parameter evidence would trigger an advisory for potential eruption within days to weeks.
4. Key Takeaways
- Volcano monitoring uses a combination of techniques, not just one, for accuracy.
- Changes in seismic activity (earthquakes) are a primary indicator of magma movement.
- Ground deformation (swelling) shows magma accumulating or moving underground.
- Gas emissions reveal the type and amount of gases released by rising magma.
- Thermal monitoring detects heat anomalies, signaling magma nearing the surface.
- The goal is to provide timely warnings for public safety, not pinpoint exact eruption times.
Common mistakes to avoid:
- Ignoring one type of data because another looks stable; you need the full picture.
- Over-interpreting a single, isolated spike in data without corroborating evidence.
- Failing to understand the baseline activity of a specific volcano before interpreting changes.
- Not communicating clear, actionable warnings to authorities and the public when justified.
5. Now Try It
Imagine you're reviewing a simplified data log for a hypothetical volcano. Over the past month, you see a steady increase in:
* Daily shallow earthquakes (from 10 to 80).
* Summit GPS uplift (totaling 5 cm).
* SO2 gas emissions (from 200 to 1000 tons/day).
* Crater lake temperature (from 25°C to 40°C).
Write a short paragraph (2-3 sentences) explaining what these combined observations likely indicate about the volcano's current state and what the next logical step for the monitoring team would be.
Frequently asked about Volcano Monitoring and Prediction Techniques
Study this next
Get the full Volcanoes geog curriculum
Clone the complete plan to your dashboard for unlimited AI-generated notes, practice quizzes, and a personalised revision schedule.
Create Free Account