Graphing Linear Equations
From the Linear graph curriculum
Graphing Linear Equations
TL;DR
Graphing linear equations means drawing a straight line that represents all the solutions to an equation like y = mx + b. You can do this by finding at least two points on the line and connecting them. The slope (m) tells you the line's steepness, and the y-intercept (b) tells you where it crosses the y-axis.
1. The Mental Model
Imagine a perfectly straight road. A linear equation is like the instruction manual for building that road, telling you exactly where to start and how steep it should be. Every point on that road is a solution to the equation.
2. The Core Material
Graphing a linear equation is about visualizing the relationship between two variables, usually x and y, that results in a straight line. The most common form you'll see is the slope-intercept form: y = mx + b.
Let's break down y = mx + b:
* y and x are your variables. For every x value, there's a corresponding y value that makes the equation true.
* m is the slope. It tells you how steep the line is and its direction. A positive m means the line goes up from left to right, while a negative m means it goes down.
* Slope is often thought of as "rise over run": (change in y) / (change in x).
* b is the y-intercept. This is the point where your line crosses the vertical y-axis. At this point, the x value is always 0. So, the y-intercept is the point (0, b).
How to Graph Using Slope-Intercept Form
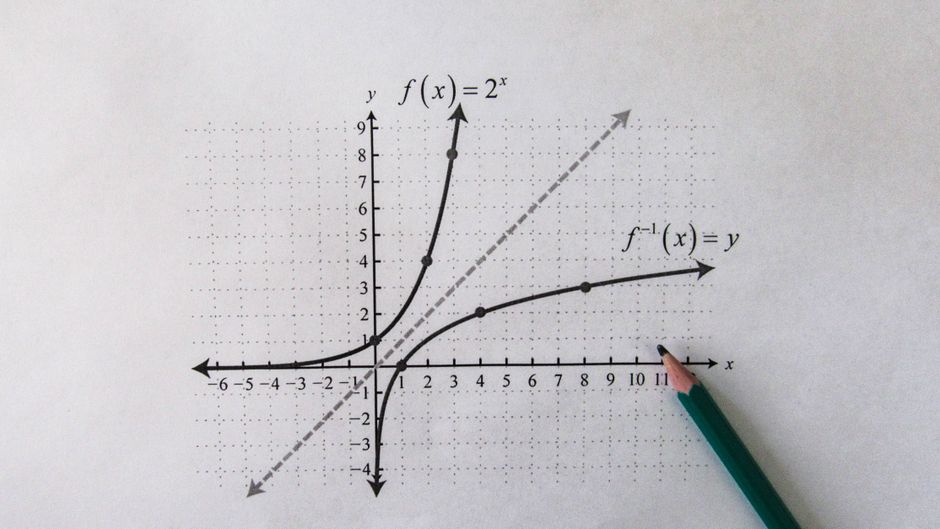
Photo by Sergey Meshkov on Pexels
- Identify the y-intercept (b): This is your starting point on the y-axis. Plot the point
(0, b). - Use the slope (m) to find a second point:
- If
mis a fraction likerise/run, moveriseunits up (if positive) or down (if negative) from your y-intercept. Then, moverununits to the right (if positive) or left (if negative). - If
mis a whole number, think of it asm/1. So,rise = mandrun = 1.
- If
- Draw the line: Connect your two points with a straight line, extending it with arrows on both ends to show it continues infinitely.
How to Graph Using Two Points (or a Table of Values)
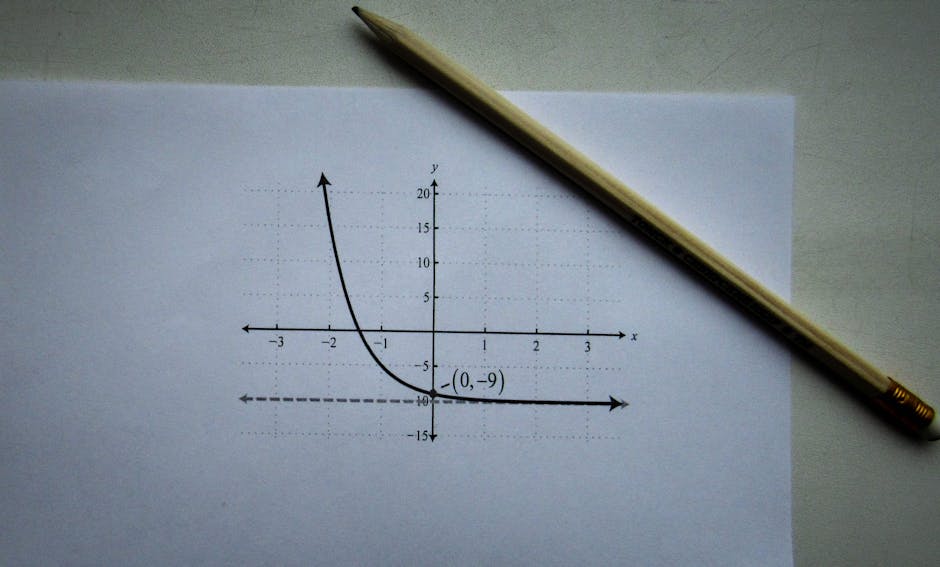
Photo by Sergey Meshkov on Pexels
If your equation isn't in slope-intercept form, or if you prefer this method:
- Pick at least two
xvalues. Choose simple numbers like0,1,-1, etc. - Substitute each
xvalue into the equation to find its correspondingyvalue. This gives you ordered pairs(x, y). - Plot these points on your coordinate plane.
- Draw a straight line connecting the points. Two points are enough to define a straight line, but a third point can be a good check for accuracy.
Here's how you can think about the different ways to approach graphing a line:
graph TD
    A["Graphing a Linear Equation"] --> B{"Equation in y = mx + b form?"};
    B -- "Yes" --> C["Identify y-intercept (b)"];
    C --> D["Plot (0, b)"];
    D --> E["Use slope (m) to find 2nd point"];
    E --> F["Connect points with a line"];
    B -- "No, or prefer table" --> G["Choose at least 2 x-values"];
    G --> H["Calculate corresponding y-values"];
    H --> I["Plot (x, y) pairs"];
    I --> F;
3. Worked Example
Let's graph the equation: y = 2x - 3
- Identify y-intercept (b): Here,
b = -3. So, our first point is(0, -3). Plot this point on the y-axis. - Identify slope (m): Here,
m = 2. We can write this as2/1. This means "rise 2, run 1". - Find a second point: Starting from
(0, -3):- Rise 2 units up (from
y = -3toy = -1). - Run 1 unit to the right (from
x = 0tox = 1). - This gives us our second point:
(1, -1).
- Rise 2 units up (from
- Draw the line: Plot
(0, -3)and(1, -1). Connect them with a ruler and extend the line in both directions with arrows.
(Self-check using a third point): Let x = 2. Then y = 2(2) - 3 = 4 - 3 = 1. So, (2, 1) should also be on the line. If you plot (2, 1), you'll see it falls perfectly on the line you've drawn, confirming your work!
4. Key Takeaways
- A linear equation always creates a straight line when graphed.
- The slope-intercept form (
y = mx + b) is super useful for quick graphing. mis the slope (rise/run), telling you steepness and direction.bis the y-intercept, where the line crosses the y-axis at(0, b).- You only need two points to draw a straight line, but a third can verify your accuracy.
- Always extend your line with arrows to show it continues infinitely.
Common mistakes to avoid:
- Confusing m and b, or mixing up the x and y coordinates.
- Incorrectly calculating rise or run (especially with negative slopes).
- Not plotting the y-intercept correctly on the y-axis (x must be 0).
- Drawing a squiggly line instead of a straight one (use a ruler!).
5. Now Try It
Graph the equation y = -3x + 1 on a piece of graph paper.
What to do:
1. Identify the y-intercept and plot it.
2. Use the slope to find a second point.
3. Draw a straight line through the two points, extending it with arrows.
4. Find a third point using any x value to verify your line.
What success looks like:
You'll have a straight line that crosses the y-axis at (0, 1) and goes downwards from left to right, passing through points like (1, -2) and (-1, 4).
Frequently asked about Graphing Linear Equations
Study this next
Get the full Linear graph curriculum
Clone the complete plan to your dashboard for unlimited AI-generated notes, practice quizzes, and a personalised revision schedule.
Create Free Account