Geographic Skills and Data Analysis
From the Geography curriculum
TL;DR
Geographic skills help us understand the world by collecting, analyzing, and visualizing spatial data. You'll learn how to use maps, remote sensing, GIS, and statistics to make sense of geographic information. These tools are crucial for solving real-world problems, from urban planning to environmental protection.
1. The Mental Model
Think of geographic skills as your toolkit for exploring and understanding places. You gather information about where things are, figure out why they're there, and then show your findings clearly to others. It’s all about turning raw data into meaningful insights about our planet.
2. The Core Material
Geographic skills cover a range of techniques that help us work with spatial data. Spatial data is information tied to a specific location on Earth.
Maps and Cartography
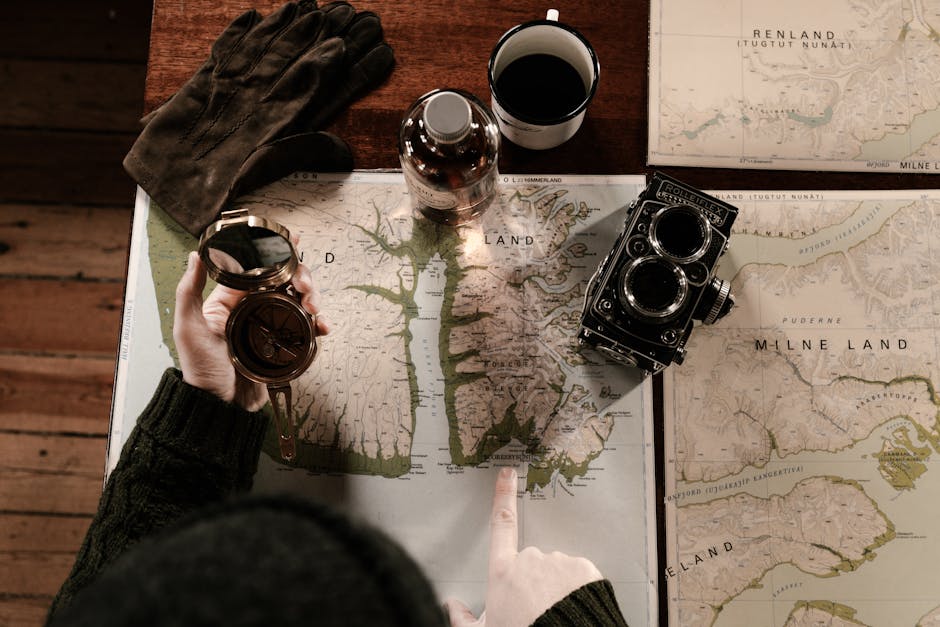
Photo by ArtHouse Studio on Pexels
Maps are fundamental to geography. Cartography is the art and science of map-making. It's not just about drawing lines; it's about choosing what to show, how to represent it, and for whom.
- Types of Maps:
- Reference Maps: Show locations of geographic features (e.g., road maps, political maps).
- Thematic Maps: Show the distribution of a particular theme or variable (e.g., population density, climate zones).
- Map Elements: Good maps have a title, legend, scale bar, north arrow, and data source.
- Projections: Earth is a 3D sphere, but maps are 2D. A map projection is a method for representing the 3D surface on a 2D plane. This always involves some distortion (of shape, area, distance, or direction). You choose a projection based on what you want to preserve or minimize distortion in.
Remote Sensing
Remote sensing is collecting information about an object or phenomenon without making physical contact with it. Think satellites or drones taking pictures from above.
- How it Works: Sensors (on satellites, aircraft) detect electromagnetic radiation reflected or emitted from Earth's surface. Different materials reflect/emit different amounts of radiation at different wavelengths.
- Applications: Monitoring deforestation, urban growth, crop health, weather patterns, disaster assessment.
- Imagery: You often work with satellite images or aerial photos. These can be in true color (what your eyes see) or false color (showing non-visible light, like infrared, to highlight specific features).
Geographic Information Systems (GIS)
GIS is a powerful computer system for capturing, storing, analyzing, managing, and presenting all types of spatial or geographical data. It combines mapping, statistical analysis, and database technology.
- Components: Hardware, software, data, people, and methods.
- Data Models:
- Vector Data: Represents discrete features using points (e.g., trees), lines (e.g., roads), and polygons (e.g., lakes). Each feature has attributes (e.g., road name, lake depth).
- Raster Data: Represents continuous phenomena using a grid of cells or pixels (e.g., elevation, temperature). Each cell has a value.
- Key Operations:
- Querying: Asking questions about the data (e.g., "Show me all cities with population over 1 million").
- Buffering: Creating a zone around a feature (e.g., a 100m buffer around a river).
- Overlay Analysis: Combining multiple layers of data to find relationships (e.g., finding areas of high population density near a flood zone).
graph TD
    A["Problem/Question"] --> B["Data Collection"];
    B --> C["Data Types: Vector (Points, Lines, Polygons)"];
    B --> D["Data Types: Raster (Grids, Pixels)"];
    C --> E["GIS Software (e.g., QGIS, ArcGIS)"];
    D --> E;
    E --> F{"GIS Analysis Operations"};
    F --> G["Querying (Selecting features)"];
    F --> H["Buffering (Creating zones)"];
    F --> I["Overlay (Combining layers)"];
    G --> J["Visualization (Maps, Charts)"];
    H --> J;
    I --> J;
    J --> K["Interpretation & Decision Making"];
Geospatial Statistics
This involves using statistical methods to analyze geographic data, taking into account spatial relationships.
- Spatial Autocorrelation: The degree to which features close to each other are more similar than features further apart (e.g., high house prices cluster together).
- Geostatistical Tools:
- Hot Spot Analysis: Identifying statistically significant clusters of high or low values.
- Interpolation: Estimating values for unmeasured locations based on known measurements (e.g., predicting temperature across an area from scattered weather stations).
- Regression Analysis: Understanding relationships between variables, often including location as a factor.
3. Worked Example
Let's say you're a city planner wanting to find the best location for a new park to serve a neighborhood, considering both accessibility and natural features.
- Define the Goal: Find optimal park location.
- Identify Data Needed:
- Neighborhood boundaries (polygon, vector)
- Existing park locations (point, vector)
- Road network (line, vector)
- Population density (raster or polygon with attributes, vector)
- Elevation/slope (raster)
- Rivers/water bodies (line/polygon, vector)
- GIS Operations:
- Buffer existing parks: Create a 500-meter buffer around existing parks to find underserved areas.
- Buffer rivers: Create a 100-meter buffer around rivers for potential green space.
- Overlay population density: Identify areas within the underserved zones that have high population density.
- Filter by slope: Use the elevation raster to identify areas that are relatively flat (e.g., less than 5% slope) to make park development easier.
- Combine Layers: Use overlay analysis to find areas that are:
- Outside existing park buffers (underserved)
- Within river buffers (natural amenity)
- High population density (high need)
- Low slope (suitable for building)
- Visualize: Create a map showing these candidate areas, along with the road network and neighborhood boundaries.
- Interpret: Analyze the resulting candidate areas. You might then visit the top few locations to assess on-the-ground conditions, considering factors GIS can't capture easily, like noise levels or specific land ownership.
This process combines different data types and GIS functions to arrive at a data-driven recommendation.
4. Key Takeaways
- Geographic skills equip you to collect, analyze, and visualize spatial data to understand our world.
- Maps are powerful communication tools, but always remember their projection introduces distortion.
- Remote sensing gathers data from afar, providing crucial information on environmental changes and land use.
- GIS integrates various data types for complex spatial analysis, revealing patterns and relationships.
- Geospatial statistics helps you quantify spatial patterns and make predictions.
- Understanding the strengths and weaknesses of different data types (vector vs. raster) is key to effective analysis.
- Your goal is to transform raw data into actionable insights for decision-making.
Common Mistakes to Avoid:
- Ignoring Scale and Projection: Not considering how map scale affects detail or how projection distorts reality can lead to wrong conclusions.
- Bad Data In, Bad Data Out (Garbage In, Garbage Out): The quality of your analysis depends entirely on the accuracy and completeness of your input data.
- Over-relying on Defaults: Not customizing map symbology or analysis parameters in GIS can hide important information or lead to generic results.
- Confusing Correlation with Causation: Just because two spatial patterns overlap doesn't mean one causes the other.
- Forgetting the "Ground Truth": Always try to verify your spatial analysis with real-world observations or data if possible.
5. Now Try It
Choose a local issue you're interested in, like finding suitable locations for community gardens or identifying areas prone to flooding. Think about what geographic data you'd need (e.g., soil type, open spaces, elevation, river locations), which geographic skills you'd apply (mapping, buffering, overlay), and how you'd visualize your findings. Sketch out a simple flow diagram (like the Mermaid one above, but for your specific problem) showing the steps from problem definition to a potential solution. What success looks like: You'll have a clear, step-by-step plan that logically uses geographic skills to address your chosen issue.
Frequently asked about Geographic Skills and Data Analysis
Study this next
Get the full Geography curriculum
Clone the complete plan to your dashboard for unlimited AI-generated notes, practice quizzes, and a personalised revision schedule.
Save this course free