Geographical Skills for Analysis
From the Geography curriculum
TL;DR
Geographical analysis means using various skills and tools to understand patterns, relationships, and changes on Earth's surface. It involves collecting, processing, and interpreting data, often using maps and GIS. Mastering these skills helps you make sense of complex geographical issues and make informed decisions.
1. The Mental Model
Think of geographical analysis as detective work for the Earth. You're gathering clues (data), looking for connections and patterns (analysis), and then explaining what you've found (interpretation) to solve geographical mysteries.
2. The Core Material
Geographical analysis isn't just one skill; it's a toolkit of interconnected abilities that help you investigate and understand the world around you. Let's break down some key areas:
Understanding Data: Qualitative vs. Quantitative
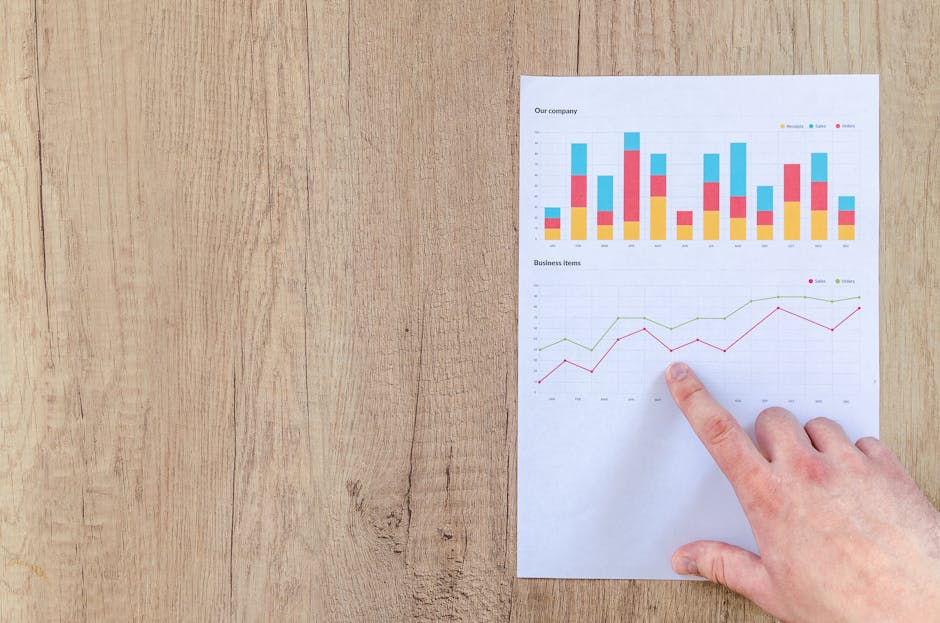
Photo by Lukas Blazek on Pexels
You'll work with two main types of data:
* Quantitative Data: This is numerical data you can measure, count, or express as a number. Think population figures, rainfall amounts, or elevation. It's great for statistical analysis.
* Qualitative Data: This describes qualities or characteristics that can't be easily measured numerically. Examples include opinions, personal experiences, or descriptions of landscapes. It often comes from interviews, observations, or textual sources and provides rich context.
Data Collection Techniques

Photo by Markus Winkler on Pexels
How do you get your data?
* Primary Data: You collect this yourself directly from the source. This could involve field surveys (like counting trees in a park), interviews with local residents, or using GPS to record locations.
* Secondary Data: This data has already been collected by someone else. Examples include government census data, satellite imagery from space agencies, academic research papers, or pre-existing maps. It's often quicker to access but you need to check its reliability.
Map Skills and Cartography
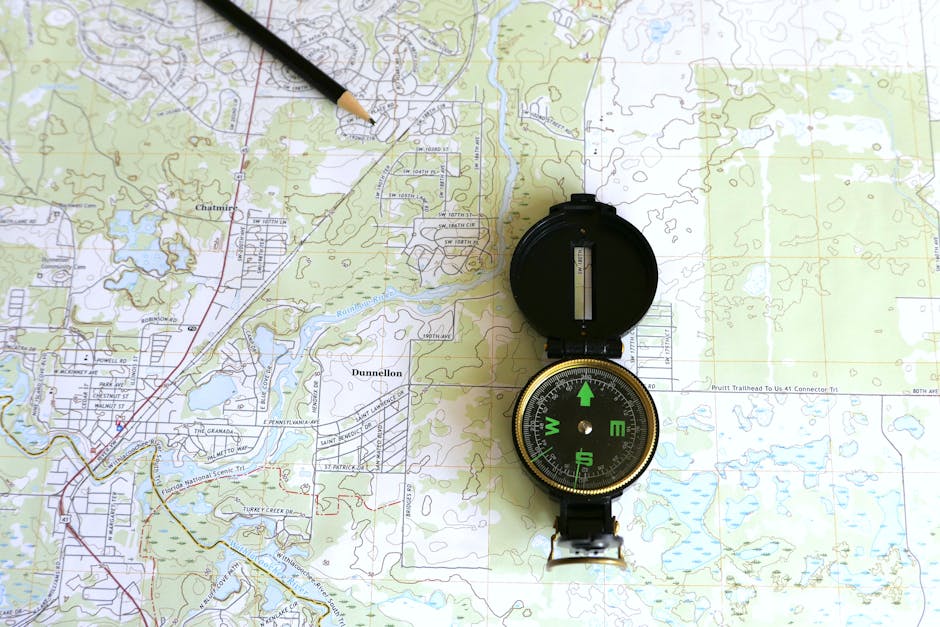
Photo by Larry Hyler on Pexels
Maps are fundamental. You need to be able to:
* Read Maps: Understand scale, symbols, grid references (like eastings and northings), contours (showing elevation), and different map projections.
* Interpret Maps: Identify patterns, relationships, and trends shown on a map. For instance, you might look at a population density map and see where people are clustered.
* Create Maps (Cartography Basics): Understand the principles of good map design – clear legends, appropriate symbols, and effective use of color to communicate your message.
Geographic Information Systems (GIS)
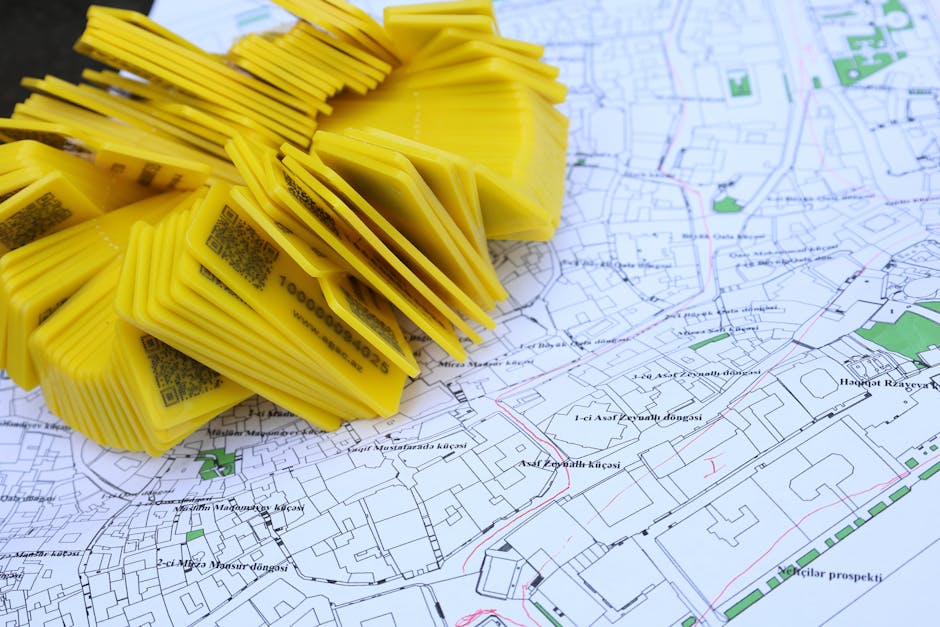
Photo by Tahir Xəlfəquliyev on Pexels
GIS is a powerful computer-based system for capturing, storing, analyzing, and managing geographical data. It lets you layer different types of information (e.g., roads, population, elevation) on a single map to see complex relationships.
* Data Layers: Imagine your map as a stack of transparent sheets, each with different information. GIS lets you turn these layers on or off.
* Spatial Analysis: GIS allows you to ask geographical questions like "What's the shortest route?" or "Where are all the areas within 5km of a river?" or "How has land use changed over time?"
Remote Sensing
This is about gathering information about objects or areas from a distance, usually from satellites or aircraft.
* Satellite Imagery: Provides a bird's-eye view of Earth, showing land cover, vegetation health, urban growth, and more.
* Aerial Photography: Similar to satellite imagery but often from lower altitudes, providing more detail.
* Interpretation: You learn to interpret these images to identify features, monitor changes, and assess environmental conditions.
Statistical Analysis
While GIS handles spatial relationships, statistics helps you understand the non-spatial numerical data.
* Descriptive Statistics: Summarizes data (e.g., mean, median, mode, range).
* Inferential Statistics: Allows you to make predictions or draw conclusions about a larger population based on a sample.
* Correlation: Identifies relationships between different variables (e.g., is there a link between income and access to green spaces?).
Here's a simplified flow of how you'd typically approach a geographical analysis project:
graph TD
    A["Define Research Question/Problem"] --> B["Identify Data Needs (Qualitative/Quantitative, Primary/Secondary)"]
    B --> C1["Collect Data (Fieldwork, Surveys, Satellite Imagery, Existing Databases)"]
    C1 --> D["Process Data (Clean, Organize, Digitize)"]
    D --> E["Analyze Data (Map Interpretation, GIS Operations, Statistical Tests)"]
    E --> F["Interpret Findings (Identify Patterns, Relationships, Anomalies)"]
    F --> G["Communicate Results (Maps, Reports, Presentations)"]
3. Worked Example
Let's say you want to analyze the accessibility of public parks in a specific city neighborhood for its residents.
- Define Research Question: "How well do residents in Neighborhood X access public parks?"
- Identify Data Needs:
- Parks: Locations and sizes of all public parks (quantitative, secondary data – from city council GIS layers).
- Residential Areas: Delineation of residential zones (quantitative, secondary data – from city planning GIS layers).
- Population Density: Number of people per residential area (quantitative, secondary data – from census).
- Road Network: To calculate travel times/distances (quantitative, secondary data – from transport authority GIS layers).
- Resident Perceptions: Opinions on park quality, perceived safety, reasons for not visiting (qualitative, primary data – via surveys/interviews).
- Collect Data: Download GIS shapefiles for parks, residential zones, roads, and census data. Design a short survey for residents.
- Process Data: Import all GIS data into a GIS software (e.g., QGIS, ArcGIS). Geocode survey responses if they include addresses.
- Analyze Data (GIS & Statistics):
- Buffering: Create 500m "buffer zones" around each park to see which residential areas fall within an easy walking distance.
- Network Analysis: Calculate the actual walking distance/time from the center of each residential block to the nearest park.
- Overlay Analysis: Overlay the buffer zones with population density data to see how many people live within easy reach.
- Statistical Analysis: Analyze survey responses to find common themes or quantify satisfaction levels (e.g., "70% of residents feel the park is safe"). Correlate population density with park access.
- Interpret Findings: You might find that Park A is within walking distance for a highly populated area, but Park B, despite being large, serves a sparsely populated zone. You might also find that while access is good, survey results show residents feel a park is unsafe.
- Communicate Results: Create maps showing park locations, buffer zones, and population density. Include charts for survey results and a written report detailing your findings and suggesting improvements (e.g., adding a crosswalk, increasing lighting in a park).
4. Key Takeaways
- Geographical analysis uses a mix of qualitative and quantitative data to understand places.
- Maps and GIS are core tools for visualizing and analyzing spatial relationships and patterns.
- Primary data is collected by you, while secondary data is sourced from others.
- Remote sensing helps gather information from a distance, like satellite images.
- Statistical analysis complements spatial analysis by interpreting numerical data.
- Always define your research question clearly before diving into data collection.
- Effective communication of your findings (through maps, reports) is crucial.
Common Mistakes to Avoid:
* Not checking data reliability: Always question where secondary data comes from and how it was collected.
* Ignoring map scale/projection: Using the wrong scale or projection can distort your analysis.
* Over-relying on one data type: A balanced approach with both qualitative and quantitative data often provides a richer understanding.
* Confusing correlation with causation: Just because two things happen together doesn't mean one caused the other.
5. Now Try It
Choose a local area you know well (e.g., your neighborhood, your school's surroundings). Spend 15 minutes thinking about a geographical question you could ask about it (e.g., "Where are the best spots for shade on a hot day?", "How has the main street changed in the last 10 years?"). Then, list at least three pieces of data you would need to answer that question and specify whether each would be primary/secondary and qualitative/quantitative. Finally, describe one geographical skill you'd use (e.g., map reading, basic GIS buffer, interpreting aerial photos) to analyze that data. Success means you've clearly identified a question, the necessary data, and a relevant analytical skill.
Frequently asked about Geographical Skills for Analysis
More from Geography
Get the full Geography curriculum
Clone the complete plan to your dashboard for unlimited AI-generated notes, practice quizzes, and a personalised revision schedule.
Save this course free