Introduction to Macroeconomics: Measuring Economic Performance
From the intro to eco curriculum
TL;DR
Macroeconomics looks at the big picture of an economy, focusing on overall performance, growth, and stability. We measure this performance using key indicators like Gross Domestic Product (GDP), inflation, and unemployment rates. Understanding these metrics helps us gauge economic health and inform policy decisions.
1. The Mental Model
Think of an economy like a giant, complex machine. Macroeconomics gives you the tools to check its "dashboard" indicators – like speed, fuel level, and engine temperature – to see how well it's running.
2. The Core Material
Macroeconomics studies the economy as a whole, rather than individual markets or consumers (which is microeconomics). It aims to understand how entire nations or regions perform economically, grow over time, and manage challenges like recessions or rising prices.
What We Measure: Key Economic Indicators
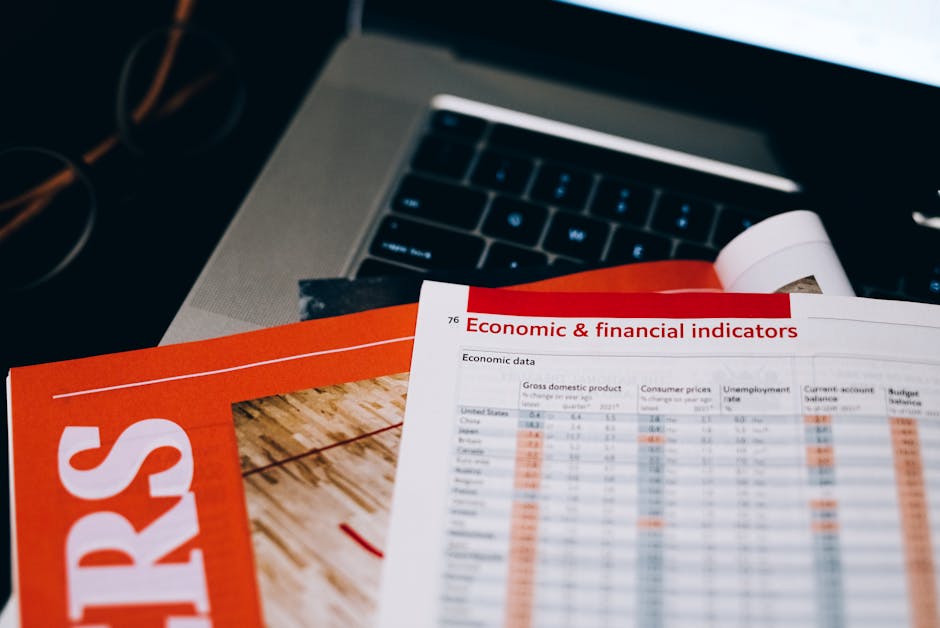
Photo by Leeloo The First on Pexels
Economists use several key indicators to measure and understand economic performance:
-
Gross Domestic Product (GDP): This is the total monetary value of all finished goods and services produced within a country's borders in a specific time period (usually a year or a quarter). It's the most common measure of a country's overall economic output and size.
- Nominal GDP: Measures output using current prices. It can increase if either production rises or prices rise.
- Real GDP: Measures output using constant prices from a base year. This helps us see if actual production has increased, removing the effect of price changes (inflation). Real GDP is a better indicator of economic growth.
-
Inflation: This is the rate at which the general level of prices for goods and services is rising, and consequently, the purchasing power of currency is falling.
- Consumer Price Index (CPI): A common measure of inflation, tracking the average change over time in the prices paid by urban consumers for a market basket of consumer goods and services.
-
Unemployment Rate: This is the percentage of the labor force that is jobless but actively seeking employment. A low unemployment rate generally indicates a healthy economy.
Why These Measurements Matter

Photo by Tima Miroshnichenko on Pexels
These indicators aren't just numbers; they tell a story about the economy:
- GDP growth tells us if the economy is expanding or contracting, indicating prosperity or recession.
- Inflation affects everyone's purchasing power. High inflation erodes savings and makes planning difficult.
- Unemployment impacts livelihoods and overall economic output. High unemployment means wasted resources (people's skills and time).
The Business Cycle

Photo by RDNE Stock project on Pexels
Economies don't just grow steadily; they go through cycles of expansion and contraction, known as the business cycle.
graph TD
    A["Expansion (Growth)"] --> B["Peak (Highest Point)"]
    B --> C["Contraction/Recession (Decline)"]
    C --> D["Trough (Lowest Point)"]
    D --> A
- Expansion: A period of economic growth, rising GDP, falling unemployment, and often moderate inflation.
- Peak: The highest point of economic activity before a downturn.
- Contraction/Recession: A period of economic decline, usually defined as two consecutive quarters of negative real GDP growth. Unemployment rises, and inflation might slow.
- Trough: The lowest point of economic activity before recovery begins.
Understanding these phases helps policymakers make decisions to smooth out these cycles, promoting stable growth.
3. Worked Example
Let's say a country, Econland, produces only two goods: smartphones and bananas.
| Year | Smartphones Produced | Price per Smartphone | Bananas Produced | Price per Banana |
|---|---|---|---|---|
| 2022 | 100 | $500 | 1,000 | $1 |
| 2023 | 110 | $550 | 1,050 | $1.10 |
Let's calculate Nominal GDP for 2022 and 2023, and Real GDP for 2023 using 2022 as the base year.
Nominal GDP 2022:
(100 smartphones * $500/smartphone) + (1,000 bananas * $1/banana)
= $50,000 + $1,000 = $51,000
Nominal GDP 2023:
(110 smartphones * $550/smartphone) + (1,050 bananas * $1.10/banana)
= $60,500 + $1,155 = $61,655
Notice Nominal GDP increased from $51,000 to $61,655. But did Econland really produce more, or did prices just go up?
Real GDP 2023 (using 2022 as base year prices):
(110 smartphones * $500/smartphone) + (1,050 bananas * $1/banana)
= $55,000 + $1,050 = $56,050
By comparing Real GDP (2022: $51,000, 2023: $56,050), we see that Econland's actual production (after removing price changes) grew from $51,000 to $56,050. This is the true measure of economic growth.
4. Key Takeaways
- Macroeconomics examines the economy as a whole, focusing on national economic performance.
- Gross Domestic Product (GDP) is the primary measure of a country's total economic output.
- Real GDP adjusts for inflation, providing a clearer picture of actual economic growth.
- Inflation measures the rate at which prices are rising, eroding purchasing power.
- The unemployment rate indicates the percentage of the labor force actively seeking jobs but not finding them.
- Economies move through a business cycle of expansion, peak, contraction, and trough.
Common Mistakes to Avoid:
- Don't confuse Nominal GDP with Real GDP; Nominal GDP includes price changes, Real GDP isolates changes in production.
- Don't think of GDP as a perfect measure of welfare; it doesn't account for income distribution, environmental quality, or non-market activities.
- Don't assume high inflation is always good or bad; moderate, predictable inflation is often a sign of a healthy growing economy.
- Don't forget that "labor force" in unemployment calculations only includes those actively working or looking for work, not everyone.
5. Now Try It
Imagine a small island economy that only produces coconuts and fish. In Year 1, they produced 500 coconuts at $2 each and 200 fish at $5 each. In Year 2, they produced 550 coconuts at $2.50 each and 210 fish at
Frequently asked about Introduction to Macroeconomics: Measuring Economic Performance
Study this next
Get the full intro to eco curriculum
Clone the complete plan to your dashboard for unlimited AI-generated notes, practice quizzes, and a personalised revision schedule.
Save this course free