Geographical Skills for Analysis
From the Geography curriculum
TL;DR
Geographical skills let you observe, interpret, and present spatial data to understand our world better. These skills involve collecting information, mapping it, analyzing patterns, and communicating your findings effectively. Mastering them helps you make informed decisions about environmental, social, and economic issues.
1. The Mental Model
Think of geographical skills as your toolkit for understanding places. You're not just looking at a map; you're figuring out why things are where they are, how they're connected, and what it all means for people and the planet.
2. The Core Material
Geographical skills are all about handling spatial information. This isn't just about memorizing capitals; it's about being able to work with data that has a "where" component.
Data Collection
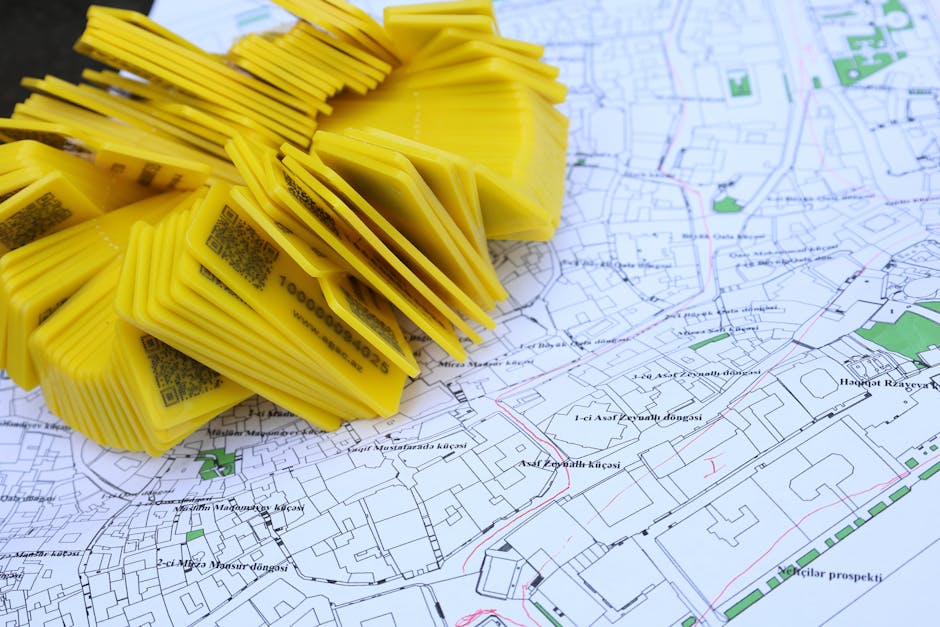
Photo by Tahir Xəlfəquliyev on Pexels
Before you can analyze anything, you need data. This can come from many sources:
- Primary Data: You collect this yourself.
- Field surveys: Going out and observing, counting, or measuring things directly (e.g., traffic counts, environmental quality surveys).
- Questionnaires/Interviews: Gathering opinions or facts from people.
- GPS (Global Positioning System): Recording precise locations.
- Secondary Data: Data collected by someone else that you use.
- Government agencies: Census data, environmental reports.
- Maps and atlases: Pre-existing geographical information.
- Satellite imagery and aerial photographs: Remote sensing data showing large areas.
- GIS (Geographic Information Systems) databases: Digital datasets that combine spatial and attribute information.
Data Presentation

Photo by Kampus Production on Pexels
Once you have data, you need to show it in a way that makes sense. Maps are the most common way to do this in geography.
- Thematic Maps: Show the distribution of a particular theme or attribute.
- Choropleth maps: Use different shades or colors to show variations in a characteristic (e.g., population density per area).
- Isoline maps: Connect points of equal value (e.g., contour lines for elevation, isobars for atmospheric pressure).
- Proportional symbol maps: Use symbols of different sizes to represent quantities (e.g., larger circles for bigger cities).
- Dot maps: Use dots to show the presence and density of a feature (e.g., one dot equals 100 people).
- Other Visualizations:
- Graphs and Charts: Bar charts, pie charts, line graphs to show trends or comparisons.
- Transects: Cross-sectional diagrams showing changes across a landscape.
Data Analysis and Interpretation

Photo by Markus Winkler on Pexels
This is where you make sense of the patterns you've presented.
- Spatial Analysis: Looking for patterns, relationships, and trends in the geographical distribution of phenomena.
- Distribution: Is something clustered, dispersed, or random?
- Association: Do two or more things occur together in space? (e.g., higher pollution near industrial areas).
- Trends: How do things change over distance or time?
- Anomaly detection: Identifying outliers or unexpected patterns.
- Statistical Analysis: Using numbers to quantify relationships and test hypotheses.
- Measures of central tendency: Mean, median, mode to describe typical values.
- Measures of dispersion: Range, standard deviation to describe spread.
- Correlation: How strongly two variables are related (e.g., between rainfall and crop yield).
- Critical Thinking: Evaluating the quality of data, recognizing bias, and considering different perspectives.
Communication
Finally, you need to communicate your findings clearly and persuasively. This could be through reports, presentations, or well-designed maps.
Here's a simplified flow of these skills:
graph TD
    A["Problem/Question"] --> B["Data Collection (Primary/Secondary)"]
    B --> C["Data Processing/Organization"]
    C --> D["Data Presentation (Maps, Graphs, etc.)"]
    D --> E["Data Analysis (Spatial, Statistical)"]
    E --> F["Interpretation & Conclusion"]
    F --> G["Communication (Report, Map, Presentation)"]
3. Worked Example
Let's say you're investigating the relationship between green space access and perceived well-being in a local neighborhood.
-
Data Collection:
- Primary: You conduct a survey asking residents about their perceived well-being (e.g., on a scale of 1-10) and how often they visit local parks. You also use GPS to map the exact boundaries of all public green spaces.
- Secondary: You get census data for the neighborhood (population density, age demographics) and existing maps showing land use.
-
Data Processing: You digitize your survey responses into a spreadsheet and import your GPS park boundaries into a GIS software. You overlay the census data onto your neighborhood map.
-
Data Presentation:
- You create a choropleth map showing average perceived well-being by street block.
- You create a proportional symbol map where the size of the symbol represents the area of each park.
- You draw buffers (a GIS function) around each park to show areas within a 5-minute walk.
-
Data Analysis:
- Spatial: You notice that areas with higher perceived well-being tend to be closer to larger green spaces. You perform a spatial correlation analysis to see if there's a statistical link between distance to green space and well-being scores.
- Statistical: You calculate the average well-being score for residents living within the 5-minute park buffer versus those outside it, and perform a t-test to see if the difference is statistically significant.
-
Interpretation: Your analysis shows a moderate positive correlation: residents living closer to parks generally report higher well-being. This suggests that access to green spaces might be a contributing factor.
-
Communication: You present these findings in a report, including your maps and statistical summaries, recommending that the local council consider investing in more accessible green spaces.
4. Key Takeaways
- Geographical skills are about understanding where things are and why they matter.
- Data collection is the first step, involving both primary (you gather) and secondary (others gathered) sources.
- Effective presentation, often through various map types, makes complex data understandable.
- Analysis involves looking for spatial patterns, relationships, and trends.
- Always critically evaluate data for accuracy, bias, and relevance.
- Clear communication of your findings is crucial for them to have an impact.
- GIS is a powerful digital tool that integrates many geographical skills.
Common Mistakes to Avoid:
- Ignoring scale: Not considering if your data or analysis is appropriate for the geographical scale you're working at (e.g., drawing conclusions about a city from street-level data).
- Correlation vs. Causation: Assuming that because two things happen together, one causes the other.
- Poor map design: Creating maps that are hard to read, lack essential elements (like a legend or scale bar), or are misleading.
- Using biased data: Relying on data from an unverified source or one with a clear agenda without critical evaluation.
- Over-generalizing: Drawing broad conclusions from limited data or a small study area.
5. Now Try It
Choose a local issue you're interested in (e.g., location of recycling bins, types of shops in your high street, noise levels). For this issue, spend 15 minutes planning:
1. What specific geographical data would you need to collect (primary and/or secondary)?
2. How would you present this data using at least one specific type of map and one type of graph?
3. What kind of spatial pattern or relationship would you look for during analysis?
Success looks like clearly outlining these three steps with specific examples related to your chosen local issue.
Frequently asked about Geographical Skills for Analysis
More from Geography
Get the full Geography curriculum
Clone the complete plan to your dashboard for unlimited AI-generated notes, practice quizzes, and a personalised revision schedule.
Save this course free