Linear Equations and Relationships
From the Core maths year 10 curriculum
TL;DR
Linear equations describe straight-line relationships between variables, helping you predict one value given another. They typically look like y = mx + c, where m is the steepness (gradient) and c is where the line crosses the y-axis (y-intercept). Understanding these parts lets you graph lines, find missing values, and solve real-world problems.
1. The Mental Model
Think of a linear relationship like a recipe: if you double one ingredient, you double the output. It's a steady, predictable change. When plotted on a graph, this steady change always forms a straight line.
2. The Core Material
Linear equations are super useful for showing how two things are connected in a simple, predictable way. The most common form you'll see is:
y = mx + c
Let's break down what each part means:
y: This is your dependent variable. Its value depends onx. Think of it as the "output".x: This is your independent variable. You choose or know its value, and it determinesy. Think of it as the "input".m: This is the gradient (or slope). It tells you how steep the line is and in which direction it's going (uphill or downhill). A positivemmeans the line goes up from left to right, and a negativemmeans it goes down.- How to find
m:m = (change in y) / (change in x)orm = (y2 - y1) / (x2 - x1).
- How to find
c: This is the y-intercept. It's the point where the line crosses the y-axis. At this point,xis always 0.
Understanding the Gradient (m)

Photo by Tara Winstead on Pexels
The gradient tells you the rate of change. For example, if y is the cost of a taxi ride and x is the distance, m would be the cost per kilometre.
- If
m = 2, for every 1 unitxincreases,yincreases by 2 units. - If
m = -3, for every 1 unitxincreases,ydecreases by 3 units. - If
m = 0, the line is horizontal (no change inyasxchanges).
Understanding the y-intercept (c)

Photo by Sami Abdullah on Pexels
The y-intercept c is your starting point or base value. In the taxi example, c could be the fixed booking fee, even if you travel 0 km.
Graphing a Linear Equation
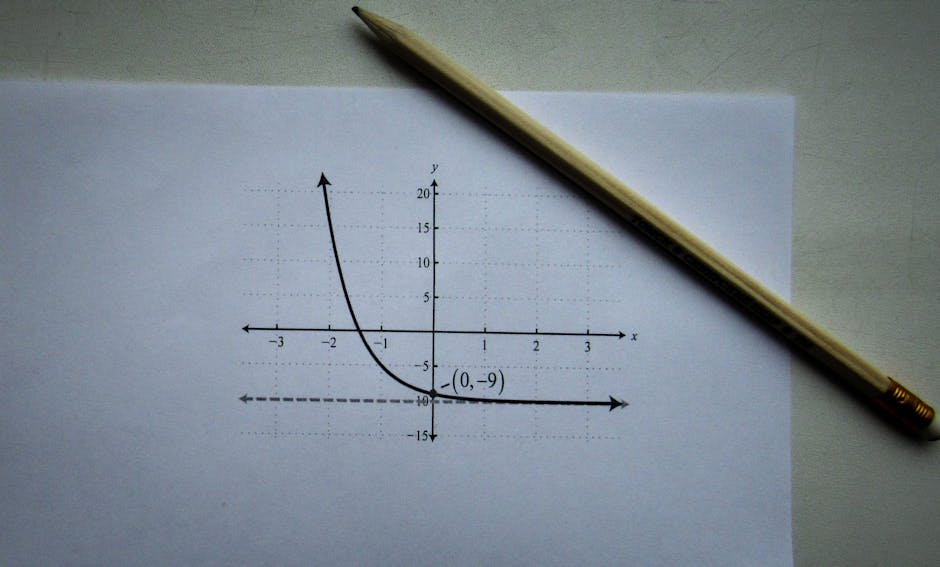
Photo by Sergey Meshkov on Pexels
To graph y = mx + c, you really only need two points, but plotting three is a good way to check your work.
- Plot the y-intercept (
c): This is the easiest point to find. Just mark(0, c)on your graph. - Use the gradient (
m) to find another point: From the y-intercept, usem = rise / run. Ifm = 2/1, go up 2 units and right 1 unit. Ifm = -3/1, go down 3 units and right 1 unit. - Draw the line: Connect your points with a straight line, extending it with arrows to show it goes on forever.
Or, you can just pick any two x values, calculate their y values, plot those two (x, y) points, and draw the line.
Rearranging Equations

Photo by Monstera Production on Pexels
Sometimes, equations aren't in the y = mx + c form. You'll need to use your algebra skills to rearrange them. The goal is to get y by itself on one side.
Example: 2x + y = 5
To get y alone, subtract 2x from both sides:
y = -2x + 5
Now you can see m = -2 and c = 5.
Here's a flowchart to help you think about graphing:
graph TD
    A["Start with an equation"] --> B{"Is it in y = mx + c form?"}
    B -- No --> C["Rearrange to y = mx + c"]
    B -- Yes --> D["Identify 'm' (gradient) and 'c' (y-intercept)"]
    D --> E["Plot the y-intercept (0, c)"]
    E --> F{"Use 'm' (rise/run) or pick another x value?"}
    F -- Use 'm' --> G["From (0,c), move 'rise' units vertically and 'run' units horizontally to find a second point"]
    F -- Pick x value --> H["Choose a value for x (e.g., x=1). Substitute into y = mx + c to find corresponding y value. Plot (x,y)"]
    G --> I["Draw a straight line through the two points"]
    H --> I
    I --> J["Extend line with arrows"]
    J --> K["End"]
3. Worked Example
Let's work with the equation: 3x - y = 6
-
Rearrange to
y = mx + cform:
3x - y = 6
Subtract3xfrom both sides:
-y = -3x + 6
Multiply the entire equation by-1(or divide by-1) to makeypositive:
y = 3x - 6 -
Identify
mandc:
Fromy = 3x - 6, we have:m = 3(The gradient is 3)c = -6(The y-intercept is -6)
-
Find points to plot:
- Y-intercept:
(0, -6) - Using gradient
m = 3(which is3/1): From(0, -6), go up 3 units and right 1 unit. This gives you the point(1, -3). - Alternative (picking another x): Let
x = 2.
y = 3(2) - 6
y = 6 - 6
y = 0
So, another point is(2, 0). This is where the line crosses the x-axis (the x-intercept).
- Y-intercept:
-
Plot these points
(0, -6),(1, -3),(2, 0)and draw a straight line through them.
4. Key Takeaways
- The form
y = mx + cis the most important for understanding linear equations. mrepresents the gradient or steepness, showing how muchychanges for each unit change inx.crepresents the y-intercept, which is where the line crosses the y-axis (whenx = 0).- To graph a linear equation, you only need two points, but using the y-intercept and gradient is often quickest.
- Always check if your equation is in
y = mx + cform before identifyingmandc.
Common Mistakes to Avoid:
- Forgetting to change the signs when moving terms across the equals sign during rearrangement.
- Confusing m and c – m is always with x, c is always the constant term.
- Miscalculating the gradient, especially with negative numbers or fractions.
- Drawing a curve instead of a straight line – linear equations always make straight lines!
5. Now Try It
You've got this! Take the equation 5x + 2y = 10.
- Rearrange it into the
y = mx + cform. - Identify the gradient (
m) and the y-intercept (c). - Find three points that lie on this line (e.g., the y-intercept, the x-intercept, and one other point).
Success looks like: You have the correct y = mx + c form, clearly stated m and c values, and three correct coordinate pairs that satisfy the equation.
Frequently asked about Linear Equations and Relationships
Study this next
Get the full Core maths year 10 curriculum
Clone the complete plan to your dashboard for unlimited AI-generated notes, practice quizzes, and a personalised revision schedule.
Save this course free