Non-Linear Relationships: Quadratics and Exponentials
From the Core maths year 10 curriculum
TL;DR
Non-linear relationships like quadratics and exponentials don't make straight lines when you graph them, unlike the linear equations you're used to. Quadratics create a U-shape (parabola), while exponentials show rapid growth or decay. Understanding their unique patterns helps you model more complex real-world situations.
1. The Mental Model
Imagine throwing a ball; its path isn't a straight line. That's a quadratic in action. Or think about how quickly a virus spreads; that's often exponential growth. These curves show how things change in a more dynamic way than just steadily increasing or decreasing.
2. The Core Material
You've probably spent a lot of time with linear relationships, where 'y' changes by a constant amount for every change in 'x' (like y = 2x + 1). Non-linear relationships are different because the rate of change isn't constant; it changes as 'x' changes.
Quadratics
A quadratic relationship is described by an equation where the highest power of the variable (usually 'x') is 2. The general form is:
y = ax² + bx + c
Here, 'a', 'b', and 'c' are just numbers (constants), and 'a' can't be zero (otherwise it'd just be linear!).
- The Shape: When you graph a quadratic equation, you get a curve called a parabola. It looks like a 'U' shape, either opening upwards or downwards.
- If 'a' is positive (e.g., y = x²), the parabola opens upwards (like a smile).
- If 'a' is negative (e.g., y = -x²), the parabola opens downwards (like a frown).
- Key Features:
- Vertex: This is the highest or lowest point of the parabola. It's where the curve changes direction.
- Axis of Symmetry: A vertical line that passes through the vertex, dividing the parabola into two mirror-image halves.
- Roots/X-intercepts: These are the points where the parabola crosses the x-axis (where y = 0). A quadratic can have two, one, or no real roots.
Exponentials
An exponential relationship is described by an equation where the variable is in the exponent. The general form is:
y = abˣ
Here, 'a' and 'b' are constants. 'a' represents the initial value (when x=0), and 'b' is the base, which must be a positive number and not equal to 1.
- The Shape: Exponential graphs show very rapid growth or decay.
- Exponential Growth: If 'b' is greater than 1 (e.g., y = 2ˣ), the graph increases very slowly at first, then shoots up incredibly quickly. Think about compound interest or population growth.
- Exponential Decay: If 'b' is between 0 and 1 (e.g., y = (0.5)ˣ), the graph decreases very quickly at first, then flattens out, getting closer and closer to zero but never quite reaching it. Think about radioactive decay or the value of a car depreciating.
- Key Features:
- Asymptote: For exponential decay, the x-axis (y=0) often acts as a horizontal asymptote. This means the curve gets infinitely close to the line but never touches or crosses it.
- Y-intercept: This is where the graph crosses the y-axis (when x = 0). For
y = abˣ, the y-intercept is (0, a).
Here's a diagram showing the key differences in graph shapes:
graph TD
    A["Relationship Types"] --> B["Linear (y = mx + c)"]
    A --> C["Non-Linear"]

    C --> D["Quadratic (y = ax² + bx + c)"]
    C --> E["Exponential (y = abˣ)"]

    D --> F["Parabola (U-shape)"]
    D --> G["Opens Up (a > 0)"]
    D --> H["Opens Down (a < 0)"]

    E --> I["Rapid Growth (b > 1)"]
    E --> J["Rapid Decay (0 < b < 1)"]
Comparing Quadratics and Exponentials
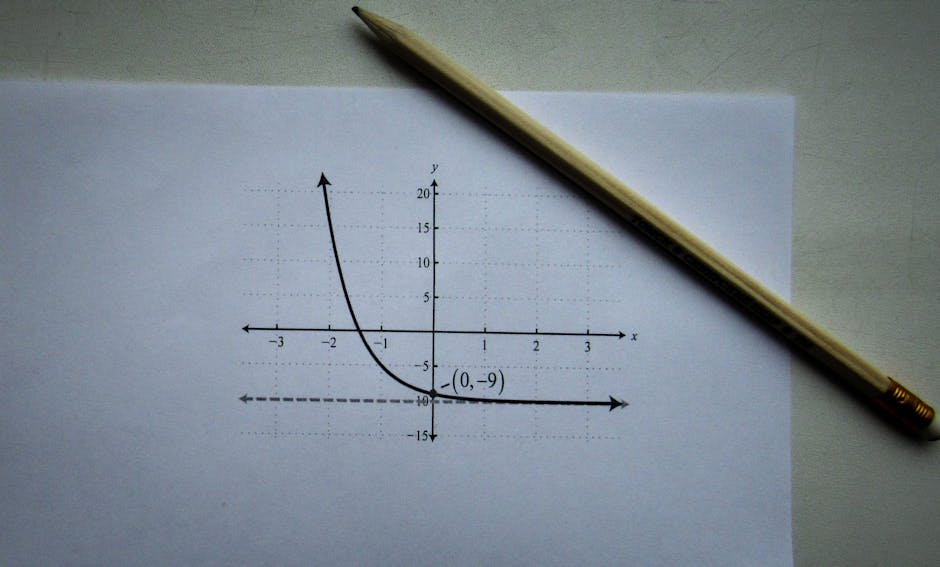
Photo by Sergey Meshkov on Pexels
The main difference is how 'y' changes.
* In quadratics, the rate of change itself changes linearly (it's symmetrical).
* In exponentials, the rate of change is proportional to the current value (it gets faster or slower relative to where it is).
3. Worked Example
Let's graph a simple quadratic and an exponential to see the difference.
Quadratic Example: y = x² - 4
- Pick some x values: -3, -2, -1, 0, 1, 2, 3
- Calculate y values:
- x = -3, y = (-3)² - 4 = 9 - 4 = 5
- x = -2, y = (-2)² - 4 = 4 - 4 = 0
- x = -1, y = (-1)² - 4 = 1 - 4 = -3
- x = 0, y = (0)² - 4 = 0 - 4 = -4
- x = 1, y = (1)² - 4 = 1 - 4 = -3
- x = 2, y = (2)² - 4 = 4 - 4 = 0
- x = 3, y = (3)² - 4 = 9 - 4 = 5
- Plot the points: (-3,5), (-2,0), (-1,-3), (0,-4), (1,-3), (2,0), (3,5)
- Connect them: You'll see a 'U'-shaped curve opening upwards. The vertex is at (0, -4) and the x-intercepts are at (-2, 0) and (2, 0).
Exponential Example: y = 2ˣ
- Pick some x values: -2, -1, 0, 1, 2, 3
- Calculate y values:
- x = -2, y = 2⁻² = 1/2² = 1/4 = 0.25
- x = -1, y = 2⁻¹ = 1/2 = 0.5
- x = 0, y = 2⁰ = 1
- x = 1, y = 2¹ = 2
- x = 2, y = 2² = 4
- x = 3, y = 2³ = 8
- Plot the points: (-2, 0.25), (-1, 0.5), (0, 1), (1, 2), (2, 4), (3, 8)
- Connect them: You'll see a curve that starts low, gets closer to the x-axis on the left, and then increases very rapidly as 'x' gets larger on the right. The y-intercept is at (0, 1).
4. Key Takeaways
- Quadratics have
x²as the highest power and graph as parabolas (U-shapes). - Exponentials have the variable in the exponent (
bˣ) and graph as rapid growth or decay curves. - The sign of 'a' in
y = ax² + bx + cdetermines if a parabola opens up (a > 0) or down (a < 0). - The base 'b' in
y = abˣdetermines if an exponential shows growth (b > 1) or decay (0 < b < 1). - Non-linear graphs model situations where the rate of change isn't constant.
- The vertex is a key feature of a parabola, representing its turning point.
- Exponentials often have an asymptote, a line the curve approaches but never touches.
Common Mistakes to Avoid:
- Confusing quadratic graphs with absolute value graphs (which are 'V' shaped, not 'U' shaped).
- Mixing up which variable is in the exponent for exponentials – it's the x, not the base!
- Assuming an exponential curve will eventually touch the x-axis during decay; it gets infinitely close but doesn't reach zero.
- Incorrectly calculating negative exponents (remember x⁻ⁿ = 1/xⁿ).
5. Now Try It
Take the quadratic equation y = -x² + 2x + 3 and the exponential equation y = 3 * (0.5)ˣ.
1. For the quadratic, determine if it opens up or down, and find the coordinates of its y-intercept.
2. For the exponential, determine if it shows growth or decay, and find the coordinates of its y-intercept.
3. Choose at least five x-values for each (including 0 for the y-intercept) and calculate the corresponding y-values.
4. Sketch both graphs on the same set of axes, labelling which is which.
Success looks like: You can correctly identify the general shape and key features of both graphs, accurately calculate points, and sketch them to reflect their non-linear nature.
Frequently asked about Non-Linear Relationships: Quadratics and Exponentials
Study this next
Get the full Core maths year 10 curriculum
Clone the complete plan to your dashboard for unlimited AI-generated notes, practice quizzes, and a personalised revision schedule.
Save this course free