Introduction to Linear Functions
From the Linear Functions curriculum
TL;DR
Linear functions describe a straight line relationship between two variables, where a change in one variable causes a proportional change in the other. They are represented by the equation y = mx + b, where 'm' is the slope and 'b' is the y-intercept. Understanding these functions helps predict outcomes and model real-world scenarios.
1. The Mental Model
Imagine you're driving at a constant speed. The further you drive, the more distance you cover in a perfectly predictable way. A linear function is like that constant speed, showing how one thing changes consistently in response to another.
2. The Core Material
A linear function shows a relationship where the output changes at a constant rate for every unit change in the input. When you plot this relationship on a graph, it always forms a straight line.
The most common form of a linear function is called the slope-intercept form:
y = mx + b
Let's break down what each part means:
y: This is your dependent variable (the output). Its value depends on the value ofx.x: This is your independent variable (the input). You choose its value, and it affectsy.m: This is the slope of the line. It tells you how steep the line is and in what direction (up or down).- A positive
mmeans the line goes up from left to right. - A negative
mmeans the line goes down from left to right. mis the "rate of change" – how muchychanges for every 1 unit change inx. You can calculate it as "rise over run":m = (change in y) / (change in x).
- A positive
b: This is the y-intercept. It's the point where the line crosses the y-axis (the vertical axis). At this point, the value ofxis always 0. It's often the starting value or a fixed cost.
Graphing a Linear Function
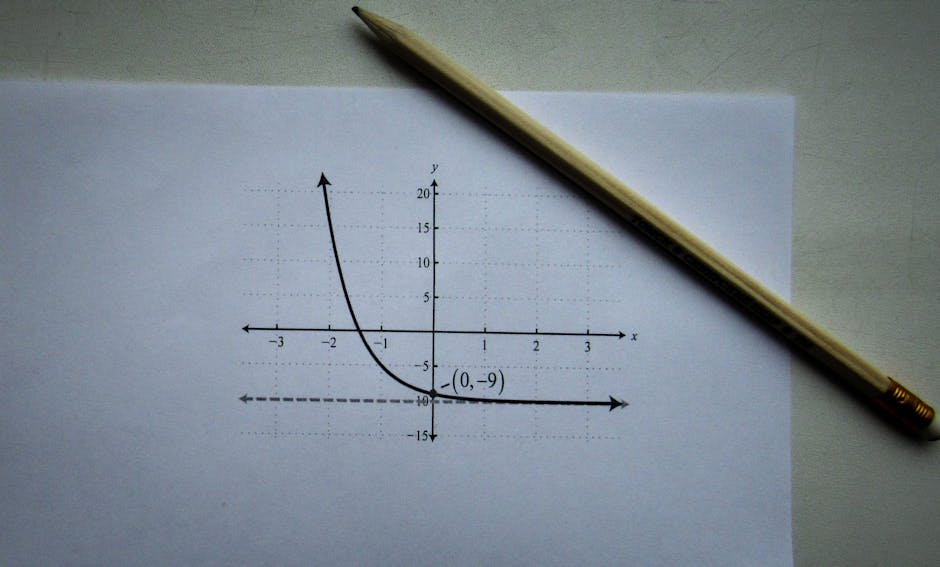
Photo by Sergey Meshkov on Pexels
To graph a linear function, you typically need two points. The y-intercept (b) gives you one easy point (0, b). From there, you can use the slope (m) to find another point.
graph TD
    A["Start with the Equation: y = mx + b"] --> B["Identify 'b' (y-intercept)"];
    B --> C["Plot the y-intercept (0, b) on the y-axis"];
    C --> D{"Is 'm' (slope) positive or negative?"};
    D -- "Positive 'm'" --> E["Move 'm' units UP for 'rise'"];
    D -- "Negative 'm'" --> F["Move 'm' units DOWN for 'rise'"];
    E --> G["Then move 1 unit RIGHT for 'run'"];
    F --> G;
    G --> H["Plot the new point"];
    H --> I["Draw a straight line through both points"];
3. Worked Example
Let's work with the linear function: y = 2x + 3.
-
Identify
mandb:m(slope) = 2b(y-intercept) = 3
-
Plot the y-intercept: This is the point
(0, b). So, plot a point at(0, 3)on your graph. -
Use the slope to find another point:
- The slope
m = 2can be written as2/1. This means for every 1 unit you move to the right on the x-axis, you move 2 units up on the y-axis. - Starting from your y-intercept
(0, 3):- Move 1 unit to the right (x goes from 0 to 1).
- Move 2 units up (y goes from 3 to 5).
- This gives you a new point:
(1, 5).
- The slope
-
Draw the line: Connect the point
(0, 3)and(1, 5)with a straight line. This line represents the functiony = 2x + 3.
4. Key Takeaways
- A linear function always produces a straight line when graphed.
- The equation
y = mx + bis the standard slope-intercept form for a linear function. mrepresents the slope, which is the constant rate of change ofywith respect tox.brepresents the y-intercept, the point where the line crosses the y-axis (wherex = 0).- You only need two points to draw a unique straight line.
- Linear functions are used to model situations with a constant rate of change, like costs over time or distance traveled.
Common Mistakes to Avoid

Photo by KATRIN BOLOVTSOVA on Pexels
- Confusing
mandb: Remembermaffects the steepness/direction,baffects where it starts on the y-axis. - Incorrectly plotting the y-intercept: It's always
(0, b), not(b, 0). - Misinterpreting the slope: If
mis a whole number (e.g., 3), remember it's3/1(rise of 3, run of 1). If it's a fraction like1/2, it's a rise of 1 for a run of 2. - Drawing a curve: Linear functions are always straight lines. If your graph isn't straight, you've made a mistake.
5. Now Try It
Take the function y = -1/2x + 4.
1. Identify its slope (m) and y-intercept (b).
2. Plot the y-intercept on a piece of graph paper.
3. Use the slope to find a second point.
4. Draw the line.
Success looks like: You have a straight line that crosses the y-axis at y=4 and goes downwards from left to right, with a gentle slope (down 1 unit for every 2 units right).
Frequently asked about Introduction to Linear Functions
Study this next
Get the full Linear Functions curriculum
Clone the complete plan to your dashboard for unlimited AI-generated notes, practice quizzes, and a personalised revision schedule.
Save this course free