Quantification and Purity Assessment of DNA
From the introduction to biochemistry curriculum
TL;DR
Quantifying DNA means finding out how much you have, usually by measuring its absorbance of UV light or using fluorescent dyes. Assessing DNA purity tells you how much contamination (like proteins or RNA) is present, which is crucial for downstream applications. Both measurements use specific ratios from UV absorbance readings to give you quick insights into your sample quality.
1. The Mental Model
Think of your DNA sample as a drink. Quantification is like knowing how much liquid is in your cup. Purity assessment is like knowing if your drink is just water, or if it also has sugar (RNA) or coffee grounds (protein) mixed in. You want to know both the amount and the quality of your drink before you use it.
2. The Core Material
When you work with DNA, you almost always need to know two things: how much DNA you have and how pure it is. This is important because the right amount of high-purity DNA is essential for experiments like PCR, cloning, or sequencing.
How to Quantify DNA

Photo by Nicola Narracci on Pexels
The most common way to quantify DNA is using a spectrophotometer. This machine shines UV light through your sample and measures how much light is absorbed. DNA, RNA, and proteins all absorb UV light, but they do so most strongly at different wavelengths:
- DNA absorbs most strongly at 260 nm.
- Proteins absorb most strongly at 280 nm.
- RNA also absorbs strongly at 260 nm, similar to DNA.
To quantify DNA, you measure the absorbance at 260 nm (A260). For double-stranded DNA (dsDNA), an A260 of 1.0 corresponds to a concentration of 50 µg/mL. So, if your A260 reading is 0.5, your concentration is 0.5 * 50 µg/mL = 25 µg/mL. Remember to account for any dilution you made to get your sample into the spectrophotometer's reading range.
How to Assess DNA Purity
Photo by Nicola Narracci on Pexels
Purity is assessed by looking at the ratios of absorbance at different wavelengths:
-
A260/A280 ratio: This ratio helps you assess protein contamination.
- Pure DNA has an A260/A280 ratio of 1.8 – 2.0.
- A ratio below 1.8 suggests protein contamination. Proteins absorb at 280 nm, so their presence lowers this ratio.
- A ratio above 2.0 can indicate RNA contamination or that the blanking solution was incorrect.
-
A260/A230 ratio: This ratio helps you assess contamination by salts, carbohydrates, or organic solvents (like phenol, guanidine thiocyanate, or ethanol) often used in DNA extraction protocols. These contaminants absorb strongly at 230 nm.
- Pure DNA has an A260/A230 ratio of 2.0 – 2.2.
- A ratio below 2.0 indicates contamination by these chemicals.
It's important to use a "blank" solution (usually the buffer your DNA is dissolved in) to calibrate the spectrophotometer before measuring your sample. This removes the absorbance contribution of the buffer itself.
graph TD
    A["Prepare DNA Sample"] --> B["Dilute Sample (if needed)"]
    B --> C["Load Spectrophotometer (e.g., NanoDrop)"]
    C --> D["Blank Spectrophotometer with Buffer"]
    D --> E["Measure Absorbance at 230nm, 260nm, 280nm"]
    E --> F{"Is A260/A280 < 1.8?"}
    E --> G{"Is A260/A230 < 2.0?"}
    F -- Yes --> H["Protein Contamination Likely (Re-purify)"]
    F -- No --> I["Good A260/A280 Ratio"]
    G -- Yes --> J["Salt/Organic Contamination Likely (Re-purify)"]
    G -- No --> K["Good A260/A230 Ratio"]
    I & K --> L["Calculate DNA Concentration (A260 * 50 µg/mL * Dilution Factor)"]
    L --> M["Assess DNA Quality for Downstream Use"]
Fluorescent Dyes for Quantification
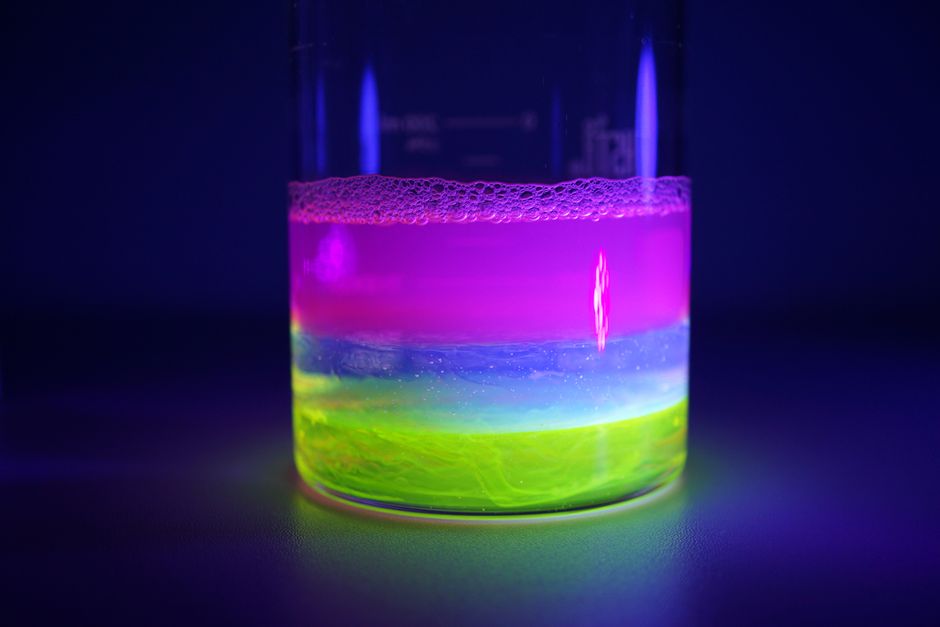
Photo by Nancy Zjaba on Pexels
While spectrophotometry is quick, it can overestimate DNA concentration if RNA is present (since RNA also absorbs at 260 nm). For more accurate quantification of only dsDNA, especially in low concentration samples or those with high RNA contamination, you can use fluorescent dyes like PicoGreen or Qubit dyes. These dyes bind specifically to dsDNA and fluoresce. The intensity of the fluorescence is proportional to the amount of dsDNA present, and a fluorometer measures this intensity. This method is more sensitive and specific than UV absorbance.
3. Worked Example
You've extracted DNA and want to know its concentration and purity. You take a 10 µL aliquot of your DNA sample and dilute it into 90 µL of TE buffer (a 1:10 dilution). You measure this diluted sample on a spectrophotometer and get the following readings:
- A260 = 0.45
- A280 = 0.23
- A230 = 0.18
Let's calculate the concentration and assess purity:
-
Calculate DNA Concentration:
- Concentration (in diluted sample) = A260 * 50 µg/mL
- Concentration = 0.45 * 50 µg/mL = 22.5 µg/mL
- Now, account for the dilution factor (10):
- Original DNA Concentration = 22.5 µg/mL * 10 = 225 µg/mL
-
Calculate A260/A280 Ratio:
- Ratio = A260 / A280 = 0.45 / 0.23 = 1.96
- This ratio (1.96) is within the ideal range of 1.8-2.0, indicating good protein purity.
-
Calculate A260/A230 Ratio:
- Ratio = A260 / A230 = 0.45 / 0.18 = 2.5
- This ratio (2.5) is slightly above the ideal range of 2.0-2.2. While not severely bad, it might suggest slight issues with the blank or a very small amount of RNA, but generally, it's considered acceptable for most applications when it's higher than the range. A low value is more concerning.
In summary, you have a good concentration of DNA (225 µg/mL) with good protein purity, and acceptable chemical purity for most uses.
4. Key Takeaways
- DNA quantification primarily uses UV absorbance at 260 nm, where an A260 of 1.0 equals 50 µg/mL dsDNA.
- The A260/A280 ratio (ideally 1.8-2.0) checks for protein contamination.
- The A260/A230 ratio (ideally 2.0-2.2) indicates contamination from salts or organic compounds.
- Always use a blank solution (usually your DNA buffer) to zero the spectrophotometer before measuring.
- Fluorescent dyes provide more specific and sensitive quantification of dsDNA compared to UV absorbance, especially with RNA contamination.
- High-purity DNA is crucial for successful downstream molecular biology experiments.
Common mistakes to avoid:
- Forgetting to blank the spectrophotometer with the correct buffer, which skews all readings.
- Not diluting highly concentrated samples, leading to absorbance readings outside the linear range of the instrument.
- Misinterpreting a low A260/A230 ratio, which often points to residual extraction chemicals.
- Assuming a good A260/A280 ratio automatically means RNA-free DNA; spectrophotometry can't distinguish DNA from RNA at 260 nm.
5. Now Try It
You've extracted DNA and measured an A260 of 0.60, an A280 of 0.35, and an A230 of 0.15 on a 1:5 diluted sample. Calculate the original DNA concentration and evaluate the purity using both ratios. What do these numbers tell you about your DNA sample and what steps, if any, might you consider next? Success looks like calculating the original concentration in µg/mL and clearly stating if the A260/A280 and A260/A230 ratios are within acceptable limits or indicate contamination.
Frequently asked about Quantification and Purity Assessment of DNA
More from introduction to biochemistry
Get the full introduction to biochemistry curriculum
Clone the complete plan to your dashboard for unlimited AI-generated notes, practice quizzes, and a personalised revision schedule.
Save this course free