Sample Measurement and Data Analysis
From the med101 1st comittee curriculum
TL;DR
When you measure things in a sample, you're trying to understand a larger population without measuring every single member. Proper sample collection and careful data analysis are crucial for drawing accurate conclusions about that larger group. Errors in either stage can lead to misleading results, so it's vital to be precise and use the right tools.
1. The Mental Model
Imagine you're baking a cake and want to check if it's done. You don't eat the whole cake; you take a small, representative bite (the sample). The taste of that bite tells you about the whole cake (the population). In medicine, we often do the same thing: a blood sample tells us about a patient's overall health.
2. The Core Material
Sample measurement and data analysis are fundamental in medical research and practice. You collect data from a portion of a larger group (the sample) and then use statistical methods to make inferences about the entire group (the population).
a. Why Sample?

Photo by Ann H on Pexels
It's often impossible, impractical, or too expensive to measure every single individual in a population. Sampling allows you to get a good estimate without this massive undertaking.
b. Key Principles of Sampling

Photo by Sergij on Pexels
- Representativeness: Your sample should reflect the characteristics of the population you're interested in. If you're studying a disease that affects both men and women, your sample should include both in appropriate proportions.
- Randomness: Ideally, every member of the population should have an equal chance of being included in your sample. This helps minimize bias.
- Sample Size: A sample that's too small might not be representative, while an unnecessarily large one wastes resources. The right size depends on the variability of the data and the precision you need.
c. Types of Measurement
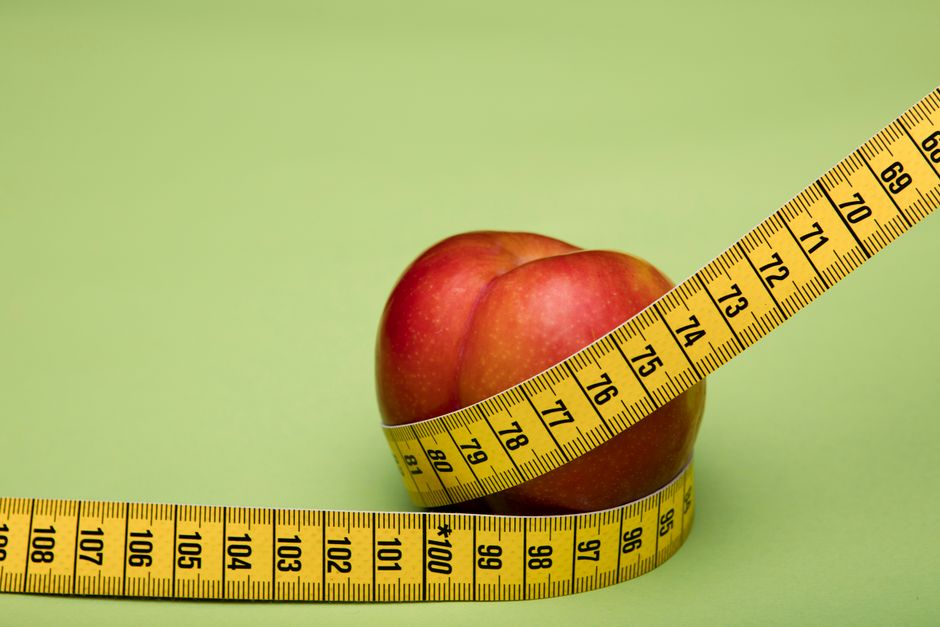
Photo by Deon Black on Pexels
- Qualitative Data: Describes qualities or characteristics (e.g., blood type, presence/absence of a symptom). Often non-numeric.
- Quantitative Data: Deals with numbers (e.g., blood pressure, age, heart rate).
- Discrete: Can only take specific, separate values (e.g., number of children, number of seizures).
- Continuous: Can take any value within a given range (e.g., height, weight, temperature).
d. Basic Data Analysis Steps
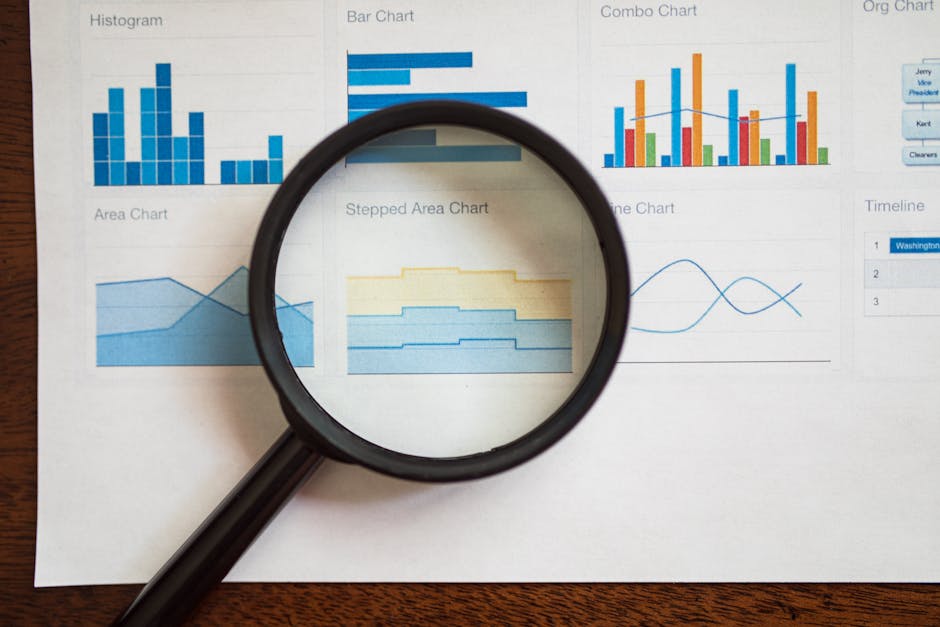
Photo by RDNE Stock project on Pexels
Once you have your measurements, you need to make sense of them.
- Data Cleaning: Check for errors, missing values, or outliers.
- Descriptive Statistics: Summarize your data. This includes measures of:
- Central Tendency: Where the data typically falls (mean, median, mode).
- Dispersion: How spread out the data is (range, standard deviation, interquartile range).
- Inferential Statistics: Use your sample data to draw conclusions about the larger population (e.g., hypothesis testing, confidence intervals).
Here's a simplified process flow for thinking about data:
graph TD
    A["Define Research Question/Goal"] --> B["Identify Target Population"]
    B --> C["Choose Sampling Method"]
    C --> D["Collect Sample Data"]
    D --> E["Clean & Organize Data"]
    E --> F["Perform Descriptive Analysis"]
    F --> G["Perform Inferential Analysis"]
    G --> H["Interpret Results & Draw Conclusions"]
    H --> I["Communicate Findings"]
e. Measures of Central Tendency
- Mean: The average (sum of all values divided by the number of values). Best for normally distributed data without extreme outliers.
- Median: The middle value when data is ordered from least to greatest. Good for skewed data or when outliers are present.
- Mode: The most frequent value. Useful for categorical data.
f. Measures of Dispersion
- Range: Difference between the highest and lowest values. Simple but sensitive to outliers.
- Standard Deviation (SD): Measures the average amount of variation or dispersion around the mean. A small SD means data points are close to the mean; a large SD means they're spread out.
- Interquartile Range (IQR): The range of the middle 50% of the data (from the 25th percentile to the 75th percentile). Good for skewed data.
3. Worked Example
Let's say you're measuring the heart rate (beats per minute) of 10 patients after administering a new medication:
Patient Heart Rates: 72, 78, 65, 80, 75, 70, 92, 73, 68, 77
-
Order the data: 65, 68, 70, 72, 73, 75, 77, 78, 80, 92
-
Calculate the Mean:
(65 + 68 + 70 + 72 + 73 + 75 + 77 + 78 + 80 + 92) / 10 = 750 / 10 = 75 bpm -
Find the Median:
Since there are 10 (an even number) values, the median is the average of the two middle values (5th and 6th):
(73 + 75) / 2 = 74 bpm -
Find the Mode:
No value appears more than once, so there is no mode in this specific dataset. -
Calculate the Range:
92 (highest) - 65 (lowest) = 27 bpm -
Interpret: The average heart rate is 75 bpm, with half the patients below 74 bpm and half above. The heart rates vary by up to 27 bpm from the lowest to the highest.
4. Key Takeaways
- Sampling allows you to study a larger population efficiently using a smaller, representative group.
- Representativeness and random selection are crucial for minimizing bias in your sample.
- Data can be qualitative (descriptive) or quantitative (numeric), with quantitative data further divided into discrete and continuous.
- Descriptive statistics like mean, median, mode, range, and standard deviation summarize your collected data.
- Inferential statistics help you generalize findings from your sample back to the larger population.
- Always clean and organize your data before attempting any analysis to ensure accuracy.
Common mistakes to avoid:
- Using a non-random or biased sampling method, which can lead to skewed results.
- Drawing conclusions about a population that is different from the one you actually sampled.
- Confusing correlation with causation; just because two things happen together doesn't mean one causes the other.
- Not checking your data for errors or outliers before performing calculations.
5. Now Try It
You're presented with a dataset of blood glucose levels (mmol/L) from 8 patients: 6.2, 5.8, 12.1, 6.5, 6.0, 5.9, 6.3, 10.5.
Calculate the mean, median, and range for this dataset.
What does the difference between the mean and median suggest about the data distribution?
Success looks like: You correctly calculate all three values and can comment briefly on the potential skewness indicated by the mean/median relationship.
Frequently asked about Sample Measurement and Data Analysis
More from med101 1st comittee
Get the full med101 1st comittee curriculum
Clone the complete plan to your dashboard for unlimited AI-generated notes, practice quizzes, and a personalised revision schedule.
Save this course free