Measurement and Data Collection
From the EXPERIMENTAL PSYCHOLOGY curriculum
TL;DR
Measurement in experimental psychology means turning abstract concepts into concrete, quantifiable data. You'll choose scales of measurement that determine what statistical analyses are appropriate for your data. Good data collection ensures your findings are reliable and valid.
1. The Mental Model
Think of it like building a house: you can't just say "make the walls strong." You need to measure the strength of the materials in specific ways (e.g., PSI for concrete), using proper tools, to ensure the house is actually sturdy and safe.
2. The Core Material
In experimental psychology, you're often trying to measure things that aren't physically tangible, like "happiness," "intelligence," or "anxiety." This requires careful thought about how you translate these concepts into numbers.
Operational Definitions

Photo by cottonbro studio on Pexels
Before you can measure anything, you need an operational definition. This is a precise description of how you'll measure a concept. For example, "anxiety" could be operationally defined as "score on the Beck Anxiety Inventory (BAI)," "number of fidgets observed in a 5-minute period," or "self-reported stress level on a 1-10 scale." Without this, your measurements are ambiguous.
Scales of Measurement
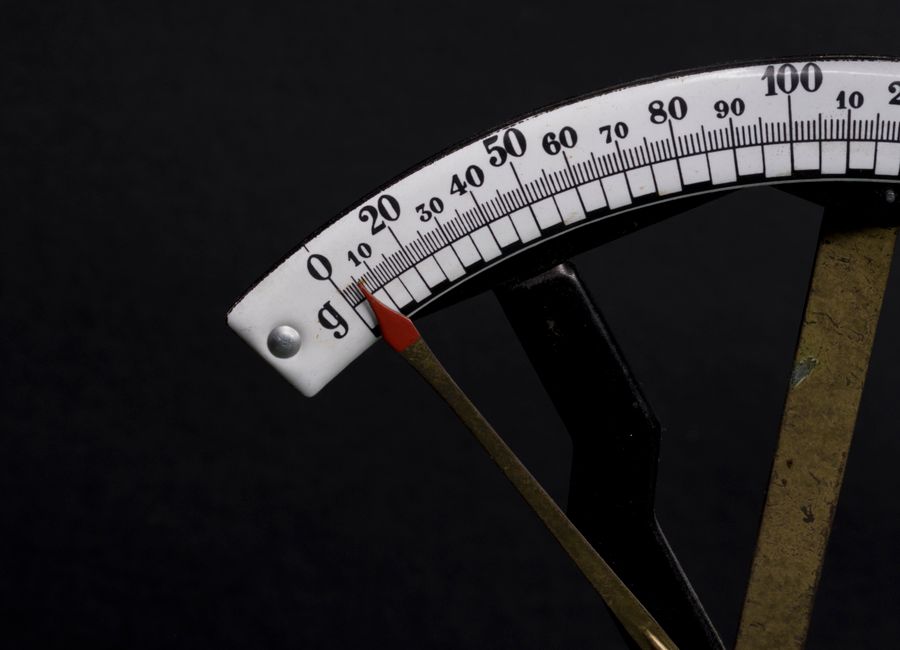
Photo by Fez Brook on Pexels
The type of scale you use dictates what kind of statistical operations you can perform. There are four main scales:
-
Nominal: Categories without order. Think "names."
- Examples: Gender (male, female, non-binary), political affiliation (Democrat, Republican, Independent).
- You can only count frequencies within categories.
-
Ordinal: Categories with a meaningful order, but unequal intervals between them.
- Examples: Educational level (high school, bachelor's, master's), Likert scale responses (strongly disagree, disagree, neutral, agree, strongly agree).
- You know something is "more" or "less" than another, but not by how much.
-
Interval: Ordered data with equal intervals between points, but no true zero point.
- Examples: Temperature in Celsius or Fahrenheit (0°C doesn't mean no temperature), IQ scores.
- You can add and subtract, but ratios aren't meaningful (e.g., 20°C isn't "twice as hot" as 10°C).
-
Ratio: Ordered data with equal intervals and a true zero point.
- Examples: Height, weight, reaction time, number of errors.
- A true zero means the absence of the measured quality, so ratios are meaningful (e.g., 20 seconds is "twice as long" as 10 seconds).
Here's a quick way to think about how they build upon each other:
graph TD
    A["Nominal (Categories, no order)"] --> B["Ordinal (Categories, ordered)"]
    B --> C["Interval (Ordered, equal intervals, no true zero)"]
    C --> D["Ratio (Ordered, equal intervals, true zero)"]
Data Collection Methods

Photo by Markus Winkler on Pexels
How you gather your data is crucial for its quality.
- Self-Report: Questionnaires, surveys, interviews.
- Pros: Direct insight into thoughts/feelings.
- Cons: Subject to bias (e.g., social desirability, recall errors).
- Behavioral Observation: Watching and recording specific actions.
- Pros: Objective, can reveal non-verbal cues.
- Cons: Can be time-consuming, risk of observer bias, participant reactivity (acting differently when watched).
- Physiological Measures: Recording biological data (e.g., heart rate, brain activity via EEG, hormone levels).
- Pros: Highly objective, less susceptible to conscious bias.
- Cons: Can be expensive, technically complex, interpretation can be tricky.
- Archival Data: Using existing records (e.g., medical records, school data).
- Pros: Efficient, can cover long periods or large populations.
- Cons: Data wasn't collected for your specific purpose, might be incomplete or inconsistent.
Reliability and Validity
Photo by Tara Winstead on Pexels
These are two fundamental concepts for evaluating your measurements.
-
Reliability: Refers to the consistency of a measure. If you measure the same thing multiple times under the same conditions, do you get similar results?
- Test-retest reliability: Administering the same test multiple times to the same people.
- Inter-rater reliability: Consistency between different observers rating the same behavior.
- Internal consistency: How well different items on a test measure the same construct (e.g., using Cronbach's alpha).
-
Validity: Refers to the accuracy of a measure – does it actually measure what it's supposed to measure?
- Face validity: Does the measure appear to measure what it's supposed to? (Least scientific).
- Content validity: Does the measure cover all relevant aspects of the construct?
- Criterion validity: Does the measure correlate with other established measures of the same construct?
- Concurrent validity: Correlates with a criterion measure taken at the same time.
- Predictive validity: Predicts future behavior or outcomes.
- Construct validity: Does the measure accurately reflect the theoretical construct it's designed to measure? (The broadest and most important type).
A measure can be reliable but not valid (e.g., a scale consistently reads 5 pounds heavy – reliable, but not valid). A measure cannot be valid if it's not reliable.
3. Worked Example
Imagine you want to study the effectiveness of a new meditation technique on "stress levels."
- Operational Definition: You decide "stress levels" will be operationally defined as scores on the Perceived Stress Scale (PSS-10) and heart rate variability (HRV) during a specific task.
- Scales of Measurement:
- PSS-10: This is typically treated as an interval scale (sum of Likert-type items, assuming equal intervals).
- HRV: This is a ratio scale (e.g., standard deviation of NN intervals, where 0 means no variability).
- Data Collection:
- PSS-10: Self-report questionnaire.
- HRV: Physiological measure using an ECG device.
- Reliability & Validity Checks:
- You'd check the PSS-10's internal consistency (e.g., Cronbach's alpha) and test-retest reliability to ensure it's a stable measure.
- For validity, you might compare PSS-10 scores to known "stressful" life events (criterion validity) or to other established stress measures (construct validity). You'd also ensure the ECG device is properly calibrated and collecting accurate HRV data.
By meticulously defining, measuring, and checking the quality of your data, you build a strong foundation for your experiment.
4. Key Takeaways
- Always start with a clear operational definition for every variable you intend to measure.
- The scale of measurement (nominal, ordinal, interval, ratio) dictates what statistical analyses you can use.
- Choose data collection methods that best suit your research question, weighing their pros and cons.
- Reliability is about consistency; validity is about accuracy.
- A measure must be reliable to be valid, but can be reliable without being valid.
- Understand that measuring psychological constructs is rarely perfect, so strive for the best possible approximation.
Common mistakes to avoid:
- Confusing operational definitions with conceptual definitions (e.g., "happiness" vs. "score on the Oxford Happiness Questionnaire").
- Using statistics appropriate for a higher-level scale (e.g., calculating means for purely nominal data).
- Assuming a measure is valid just because it's commonly used, without checking its validity in your context.
- Neglecting to consider potential biases inherent in your chosen data collection method.
5. Now Try It
Choose an abstract psychological concept like "empathy" or "creativity." Spend 15 minutes:
1. Formulate two distinct operational definitions for it.
2. For each definition, identify the likely scale of measurement.
3. Suggest a primary data collection method for each, listing one advantage and one disadvantage.
Success looks like: You have two well-defined operational definitions, correctly assigned scales of measurement, and thoughtfully considered data collection methods with their trade-offs.
Frequently asked about Measurement and Data Collection
Study this next
Get the full EXPERIMENTAL PSYCHOLOGY curriculum
Clone the complete plan to your dashboard for unlimited AI-generated notes, practice quizzes, and a personalised revision schedule.
Save this course free