Functions and Their Graphs
From the pre calculus curriculum
TL;DR
Functions relate inputs to outputs with a unique output for every input, and their graphs are visual representations of this relationship. Understanding domain and range is crucial for defining what goes into and comes out of a function. Different types of functions have distinct graph shapes and properties.
1. The Mental Model
Think of a function as a machine: you put something in (the input), and it gives you exactly one thing back (the output). The graph is like a picture of what that machine does for all possible inputs.
2. The Core Material
A function is a special type of relation where each input (from the domain) corresponds to exactly one output (in the range). This "exactly one output" rule is key.
You can often represent a function using an equation, like $f(x) = x^2$, where $x$ is the input and $f(x)$ is the output.
2.1 Domain and Range
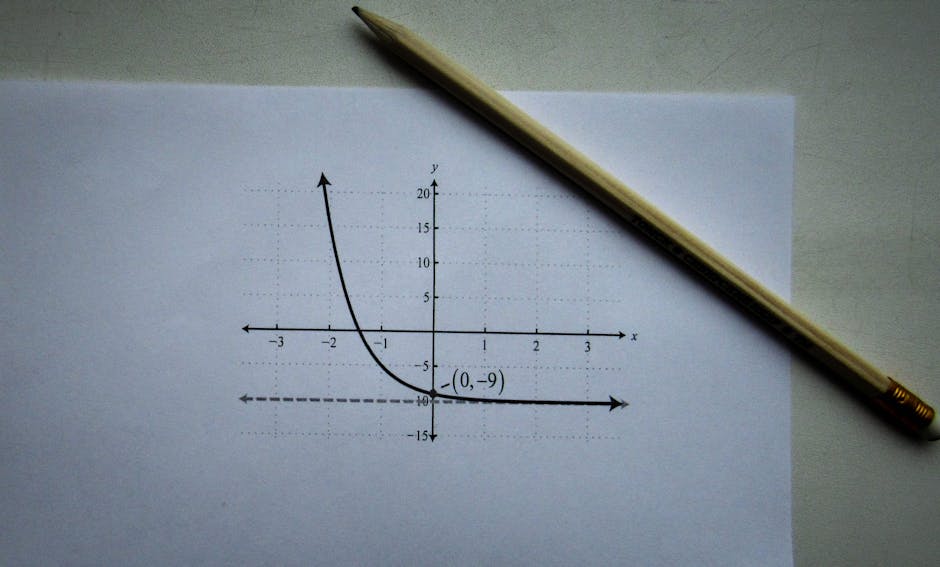
Photo by Sergey Meshkov on Pexels
- Domain: These are all the possible input values ($x$) for which the function is defined. For many functions, the domain is all real numbers ($\mathbb{R}$), but you need to watch out for:
- Division by zero (e.g., $f(x) = 1/x$, $x \neq 0$)
- Square roots of negative numbers (e.g., $f(x) = \sqrt{x}$, $x \ge 0$)
- Range: These are all the possible output values ($y$ or $f(x)$) that the function can produce. The range often depends on the function's equation and its domain.
2.2 The Vertical Line Test

Photo by Nataliya Vaitkevich on Pexels
A quick way to check if a graph represents a function is the Vertical Line Test. If any vertical line intersects the graph at more than one point, it's NOT a function. This is because multiple $y$-values (outputs) for a single $x$-value (input) would violate the function definition.
graph TD
    A["Draw a vertical line"] --> B{"Does it cross the graph more than once?"}
    B -- "Yes" --> C["Not a Function"]
    B -- "No" --> D["It is a Function"]
2.3 Common Types of Functions and Their Graphs
Photo by Sergey Meshkov on Pexels
- Linear Functions: $f(x) = mx + b$. Their graphs are straight lines.
- Domain: All real numbers.
- Range: All real numbers (unless $m=0$, then it's a horizontal line, and the range is just $y=b$).
- Quadratic Functions: $f(x) = ax^2 + bx + c$. Their graphs are parabolas (U-shaped curves).
- Domain: All real numbers.
- Range: Depends on the vertex of the parabola.
- Polynomial Functions: $f(x) = a_n x^n + ... + a_1 x + a_0$. Smooth, continuous curves.
- Domain: All real numbers.
- Rational Functions: $f(x) = P(x) / Q(x)$, where $P(x)$ and $Q(x)$ are polynomials. These often have asymptotes (lines the graph approaches but never touches).
- Domain: All real numbers except where $Q(x) = 0$.
- Radical Functions: $f(x) = \sqrt[n]{g(x)}$.
- Domain: If $n$ is even, $g(x) \ge 0$. If $n$ is odd, all real numbers.
2.4 Graphing Basics
Photo by Sergey Meshkov on Pexels
To graph a function:
1. Determine the domain.
2. Choose several $x$-values from the domain (including some positive, negative, and zero if appropriate).
3. Calculate the corresponding $y$-values using the function's equation.
4. Plot the $(x, y)$ points.
5. Connect the points with a smooth curve or line, respecting the function's type and domain/range.
3. Worked Example
Let's consider the function $f(x) = \sqrt{x-2}$.
-
Find the domain: We can't take the square root of a negative number. So, the expression inside the square root must be non-negative:
$x - 2 \ge 0$
$x \ge 2$
The domain is $[2, \infty)$. -
Find the range: Since $\sqrt{\text{anything non-negative}}$ always results in a non-negative number, the smallest output will be $\sqrt{0} = 0$. As $x$ increases, $f(x)$ also increases.
The range is $[0, \infty)$. -
Create a table of values and plot:
- If $x=2$, $f(2) = \sqrt{2-2} = \sqrt{0} = 0$. Point: $(2,0)$
- If $x=3$, $f(3) = \sqrt{3-2} = \sqrt{1} = 1$. Point: $(3,1)$
- If $x=6$, $f(6) = \sqrt{6-2} = \sqrt{4} = 2$. Point: $(6,2)$
- If $x=11$, $f(11) = \sqrt{11-2} = \sqrt{9} = 3$. Point: $(11,3)$
Plot these points on a coordinate plane and connect them with a smooth curve starting at $(2,0)$ and extending upwards and to the right. Notice how the graph only exists for $x \ge 2$, consistent with our domain.
4. Key Takeaways
- Every input to a function must have exactly one output.
- The domain is all possible input values, while the range is all possible output values.
- The Vertical Line Test helps you visually determine if a graph represents a function.
- Different types of functions (linear, quadratic, etc.) have predictable graph shapes.
- Pay close attention to restrictions on the domain, especially with division or even roots.
-
Graphs are powerful visual tools for understanding function behavior.
-
Common mistakes:
- Assuming the domain is always all real numbers.
- Confusing domain with range.
- Drawing a graph that fails the Vertical Line Test and calling it a function.
- Not considering restrictions for square roots (non-negative) or denominators (non-zero).
5. Now Try It
Given the function $g(x) = \frac{1}{x+3}$:
1. Determine its domain and range.
2. Create a small table of values for $x = -5, -4, -2, -1, 0$.
3. Sketch the graph using these points and your understanding of rational functions (think about what happens near $x=-3$).
4. Apply the Vertical Line Test to your sketch.
Success looks like: Correctly identified domain and range, a table with calculated points, and a sketch that clearly shows the function's behavior, including a vertical asymptote at $x=-3$, and passes the Vertical Line Test.
Frequently asked about Functions and Their Graphs
Study this next
Get the full pre calculus curriculum
Clone the complete plan to your dashboard for unlimited AI-generated notes, practice quizzes, and a personalised revision schedule.
Save this course free