Measurement and Recording Techniques
From the PHYSICS PRAC curriculum
TL;DR
Accurate measurement is fundamental to physics, relying on understanding instrument limitations and proper recording methods. Always consider uncertainty in your readings and use correct units and significant figures. Clear, consistent recording ensures your experimental data is reliable and understandable.
1. The Mental Model
Think of measurements as detective work: you're trying to find a value, but your tools aren't perfect, and you need to document everything precisely so others can follow your investigation.
2. The Core Material
When you're doing a physics practical, you're constantly measuring things – length, time, mass, voltage, etc. It's crucial to do this accurately and record your findings properly.
Reading Instruments Correctly
Photo by Djenz Van Eysendeyk on Pexels
Different instruments have different ways of being read and different levels of precision.
- Analogue Scales (e.g., ruler, thermometer, analogue ammeter):
- Read to the smallest division, then estimate one more digit between the divisions.
- Always read perpendicular to the scale to avoid parallax error (where your eye position changes the apparent reading).
- Digital Displays (e.g., digital stopwatch, multimeter):
- Read all digits shown. The precision is usually limited by the last digit displayed.
- Vernier Calipers / Micrometer Screw Gauge: These have specific techniques for reading both the main scale and the vernier/thimble scale. You'll learn these in detail when you use them.
Understanding Uncertainty (Error)

Photo by Vie Studio on Pexels
No measurement is perfect; there's always some uncertainty. It's not a "mistake" but a reflection of the precision of your instrument and the measurement process.
- Instrumental Uncertainty: This is the smallest division on an analogue scale (or half the smallest division for a more precise estimate), or the last digit for a digital display.
- For a ruler marked in mm, the uncertainty is usually $\pm 0.5 \text{ mm}$ or $\pm 1 \text{ mm}$.
- For a digital stopwatch reading to $0.01 \text{ s}$, the uncertainty is $\pm 0.01 \text{ s}$.
- Random Error: Fluctuations due to unpredictable changes (e.g., slightly different starting times for a stopwatch, reading parallax). You can reduce random error by taking multiple readings and calculating an average.
- Systematic Error: Consistent errors that shift all measurements in the same direction (e.g., a ruler that's slightly too long, a zero error on a balance). These are harder to detect and fix.
Recording Data
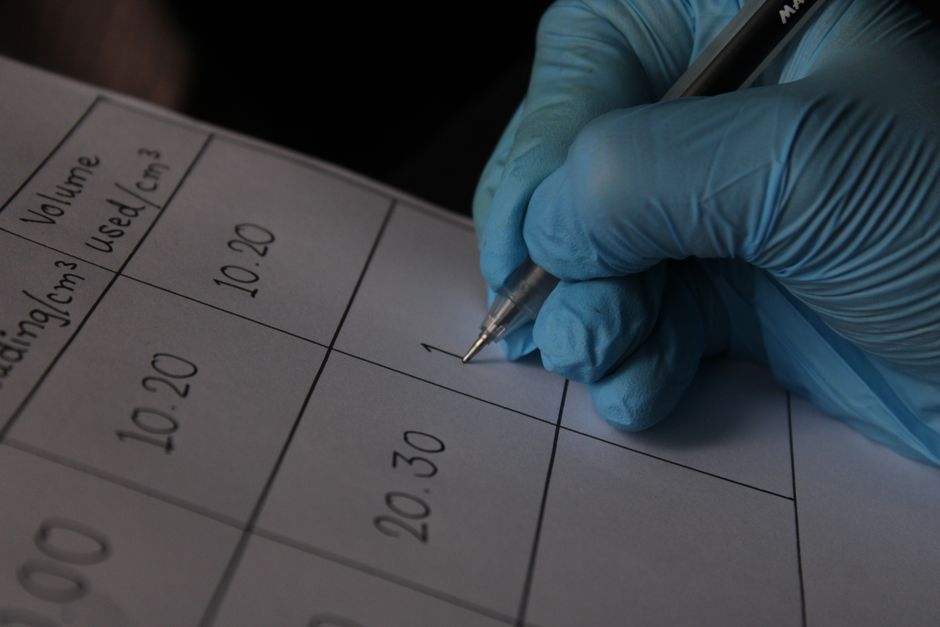
Photo by Jahra Tasfia Reza on Pexels
Good record-keeping is vital.
- Tables: Use clear, well-organised tables with headings, units, and uncertainty where appropriate.
- Units: Always include the correct SI units (e.g., m, s, kg, A, V).
- Significant Figures: Your recorded data should reflect the precision of your measurement.
- The number of significant figures in your result should generally match the least precise measurement used in the calculation.
- Uncertainty is usually given to one significant figure, and the measured value is rounded so its last significant figure is in the same decimal place as the uncertainty.
Here's a flowchart for how you should approach taking and recording a measurement:
graph TD
    A["Identify Quantity to Measure"] --> B["Choose Appropriate Instrument"];
    B --> C{"Is it an Analogue Instrument?"};
    C -- Yes --> D["Read Smallest Division"];
    D --> E["Estimate One More Digit (Avoid Parallax)"];
    C -- No --> F["Read All Digits (Digital Display)"];
    E --> G["Determine Instrument Uncertainty (e.g., ± 0.5 smallest div)"];
    F --> G;
    G --> H["Consider Other Errors (e.g., reaction time for stopwatch)"];
    H --> I["Repeat Measurement (if possible)"];
    I --> J["Calculate Average (if repeated)"];
    J --> K["Record Value with Unit & Uncertainty (e.g., 2.5 ± 0.1 cm)"];
    K --> L["Record in a Clear, Labelled Table"];
    L --> M["Consider Significant Figures"];
3. Worked Example
Let's say you're measuring the length of a string using a standard metre rule.
- Instrument: Metre rule, marked in millimetres (mm).
- Smallest Division: $1 \text{ mm}$.
- Uncertainty: For a single reading, it's typically $\pm 0.5 \text{ mm}$ (if you're careful) or $\pm 1 \text{ mm}$ (a more conservative estimate). Let's use $\pm 1 \text{ mm}$.
- Reading: You carefully align the string at the $0 \text{ cm}$ mark and read the other end. It falls between $34.2 \text{ cm}$ and $34.3 \text{ cm}$. You estimate it's exactly halfway, so $34.25 \text{ cm}$.
- Recording:
- Your raw reading: $34.25 \text{ cm}$.
- Uncertainty: $\pm 1 \text{ mm}$ which is $\pm 0.1 \text{ cm}$.
- You need to match the precision of the reading to the uncertainty. The uncertainty is to one decimal place, so your measurement should also be to one decimal place.
- Rounded reading: $34.3 \text{ cm}$.
- Final recorded value: Length = $34.3 \pm 0.1 \text{ cm}$.
If you repeated the measurement three times and got $34.3 \text{ cm}$, $34.1 \text{ cm}$, and $34.4 \text{ cm}$:
* Average = $(34.3 + 34.1 + 34.4) / 3 = 34.266... \text{ cm}$.
* You'd still consider the instrument uncertainty and perhaps the range of your readings. For a simple average, you might report $34.3 \pm 0.1 \text{ cm}$, or if the spread is larger than the instrument uncertainty, you might use half the range as a more realistic uncertainty estimate.
4. Key Takeaways
- Always understand the smallest division and inherent uncertainty of your measuring instrument.
- Read analogue scales carefully, estimating the final digit and avoiding parallax error.
- Record all measurements in clear, labelled tables, including units and uncertainties.
- The number of significant figures in your recorded value should reflect the precision of your measurement.
- Uncertainty quantifies the reliability of your measurement, not necessarily a mistake.
- Take multiple readings to reduce random errors and get a more reliable average.
- Be aware of systematic errors and try to eliminate them or account for their effect.
5. Now Try It
For the next lab, before you make any measurements, pick three different measuring instruments (e.g., a ruler, a stopwatch, and a thermometer). For each, identify its smallest division, its typical instrumental uncertainty, and how you would record a single measurement taken with it (including estimated uncertainty and correct significant figures). Write down your findings in a small table.
Frequently asked about Measurement and Recording Techniques
Study this next
Get the full PHYSICS PRAC curriculum
Clone the complete plan to your dashboard for unlimited AI-generated notes, practice quizzes, and a personalised revision schedule.
Create Free Account