Participatory Tools for Data Collection and Analysis
From the agricultural extension curriculum
TL;DR
Participatory tools involve local communities directly in gathering and understanding information about their own situations. They help you get rich, contextualized data by empowering people to share their knowledge and perspectives. Using these tools fosters trust, ownership, and more sustainable agricultural development solutions.
1. The Mental Model
Think of these tools as ways to co-create knowledge with farmers and community members, not just extracting information from them. It's like building a puzzle together where everyone contributes their unique pieces to see the full picture. This shared understanding leads to better decisions.
2. The Core Material
Participatory tools are powerful because they put the community at the center of the data process. Instead of you asking questions and filling out forms, community members actively draw, map, rank, and discuss their realities. This approach helps overcome literacy barriers and cultural differences, making data collection more inclusive and accurate.
You're not just collecting data; you're facilitating a learning process for everyone involved. The data gathered is often qualitative, providing deep insights into local contexts, perceptions, and priorities that quantitative surveys might miss.
Key Participatory Tools

Photo by Sóc Năng Động on Pexels
-
Participatory Rural Appraisal (PRA) & Participatory Learning and Action (PLA) Techniques: These are broad frameworks that encompass many tools. They emphasize learning by doing, flexibility, and empowering local people.
-
Community Mapping:
- What it is: Local people draw maps of their village, farms, resources (water sources, forests), land use, and even social boundaries.
- Why use it: Reveals local perceptions of space, resource distribution, access issues, and historical changes. It's great for identifying common property resources or areas prone to issues like erosion.
-
Transect Walks:
- What it is: You and community members walk together through different areas of the community (e.g., from the village center to agricultural fields, then to a forest edge). Along the way, you observe, discuss, and record key features, problems, and opportunities.
- Why use it: Provides direct observation and ground-truthing of information, fostering rich discussions about environmental conditions, farming practices, and resource management zones.
-
Seasonal Calendars:
- What it is: Community members create a visual calendar (often a large drawing or chart) showing seasonal variations in activities (planting, harvesting), rainfall, food availability, diseases, income, and expenditure over a year.
- Why use it: Helps understand livelihood patterns, critical periods of scarcity or labor demand, and opportunities for intervention.
-
Wealth Ranking / Well-being Analysis:
- What it is: Community members define their own criteria for "wealth" or "well-being" and then use these to categorize households or individuals within the community.
- Why use it: Provides local perspectives on poverty and inequality, helping identify vulnerable groups and understanding the dynamics of social stratification. This is more nuanced than simple income-based categories.
-
Matrix Ranking / Scoring:
- What it is: A group activity where different options (e.g., crop varieties, farming practices, development interventions) are listed and then ranked or scored against locally defined criteria (e.g., yield, cost, labor, market demand).
- Why use it: Facilitates group decision-making, helps prioritize problems or solutions, and reveals community preferences and trade-offs.
-
Problem Tree Analysis / Objective Tree Analysis:
- What it is: Visually mapping out a central problem, identifying its root causes (below the trunk), and its effects (above the trunk). An Objective Tree flips this to show how turning causes into solutions leads to desired outcomes.
- Why use it: Helps a community systematically understand complex issues, identify underlying factors, and collaboratively design logical interventions.
Analysis with Participatory Tools
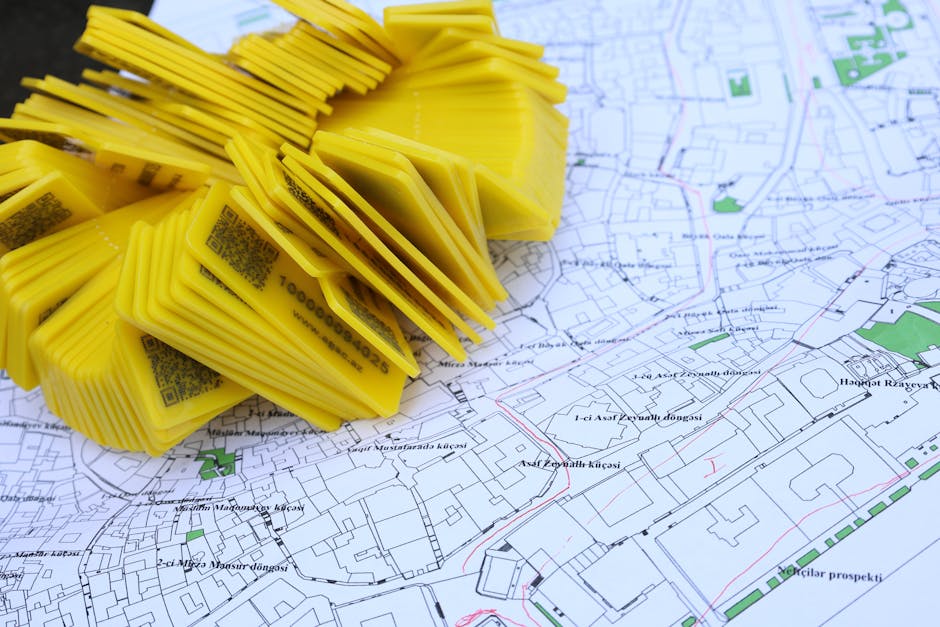
Photo by Tahir Xəlfəquliyev on Pexels
Analysis isn't just for you; it's an ongoing process with the community.
* During data collection: Discussions while mapping or ranking are already a form of analysis, as people explain their choices.
* After data collection: Facilitate group discussions to interpret the results. What do the maps tell us? Why did we rank these options this way?
* Triangulation: Compare data from different tools and sources (e.g., map data with transect walk observations, or seasonal calendar info with household interviews) to validate findings and gain a more complete picture.
* Visualization: Keep data visual and accessible to the community. Charts, diagrams, and summary drawings can help in joint analysis and decision-making.
graph TD
    A["Problem Identification/Entry Point"] --> B{Choose Appropriate Tools};
    B --> C["Community Mapping"];
    B --> D["Transect Walks"];
    B --> E["Seasonal Calendars"];
    B --> F["Matrix Ranking"];
    B --> G["Problem Tree Analysis"];

    C --> H["Shared Visual Data (Maps)"];
    D --> I["Direct Observations & Discussions"];
    E --> J["Temporal Patterns (Activities, Risks)"];
    F --> K["Prioritized Options/Criteria"];
    G --> L["Root Causes & Effects Identified"];

    H & I & J & K & L --> M["Joint Interpretation & Discussion"];
    M --> N{"What are the key insights?"};
    N --> O["Validation & Triangulation"];
    O --> P["Action Planning / Intervention Design"];
    P --> Q["Monitoring & Evaluation (often using new participatory tools)"];
3. Worked Example
Imagine you're trying to understand water scarcity in a village. You facilitate a Seasonal Calendar activity with a group of farmers.
- Preparation: You bring a large sheet of paper, markers, and invite about 8-10 diverse farmers (men, women, different age groups).
- Introduction: Explain that you want to understand how water availability changes throughout the year and how it affects their lives.
- Activity:
- Draw 12 columns for months and rows for key factors like "Rainfall," "Water for Irrigation," "Drinking Water," "Crop Planting," "Crop Harvesting," "Food Availability," "Sickness," "Income."
- Start with rainfall. Ask, "Which months have heavy rain?" "Which have none?" Farmers use symbols (e.g., large drops for heavy rain, small drops for light, clouds for dry).
- Move to "Water for Irrigation." "When is it plentiful?" "When is it scarce?" They might draw full buckets or empty buckets.
- Continue for each row, facilitating discussion and encouraging debate among them until a consensus is reached for each month's entry.
- Analysis: The completed calendar clearly shows two distinct dry seasons where rainfall is minimal, irrigation water is scarce, and drinking water becomes a major issue. Food availability also dips significantly during these times, coinciding with a rise in sickness and a drop in income.
- Outcome: This visual data makes it clear when water problems are most acute and helps the community prioritize actions like building rainwater harvesting structures before the dry seasons or managing shared water points more effectively during scarcity. It's far more impactful than just asking "Is water a problem?"
4. Key Takeaways
- Participatory tools empower communities by involving them directly in data collection and analysis.
- They provide rich, contextualized qualitative data that deepens understanding of local realities.
- These tools help overcome literacy and cultural barriers, making data collection more inclusive.
- Joint analysis with the community builds ownership and commitment to solutions.
- Triangulating data from different participatory tools strengthens the validity of findings.
- Always choose tools appropriate to the specific question and the community's context.
Common Mistakes to Avoid:
- Dominating the process: Don't impose your views; let the community lead the discussion and analysis.
- Extracting without returning: Don't just take the data and leave; share findings and plan next steps with the community.
- Ignoring local knowledge: Assume community members are the experts on their own situation.
- Being inflexible: Don't stick rigidly to a plan if the community's needs or interests shift.
- Poor facilitation: Lack of clear instructions or an inability to manage group dynamics can hinder effectiveness.
5. Now Try It
Think about a common agricultural problem in your region (e.g., low yields, pest outbreaks, market access issues). Choose one participatory tool from the list above that you think would be most effective in understanding this problem from a farmer's perspective. Briefly describe how you would use it, what kind of data you'd expect to gather, and what specific insights you hope to gain.
What success looks like: You've clearly identified a relevant tool, outlined the steps for its application to your chosen problem, and articulated how the expected community-generated data would offer specific, actionable insights.
Frequently asked about Participatory Tools for Data Collection and Analysis
More from agricultural extension
Get the full agricultural extension curriculum
Clone the complete plan to your dashboard for unlimited AI-generated notes, practice quizzes, and a personalised revision schedule.
Save this course free