Scientific Skills and Investigation
From the science curriculum
TL;DR
Scientific investigation is all about asking questions and systematically finding answers using experiments and observations. You'll learn to design experiments, collect data carefully, and then make sense of it to draw valid conclusions. Mastering these skills helps you understand the world around you in a logical, evidence-based way.
1. The Mental Model
Think of yourself as a detective. You observe something, wonder "why?", and then carefully set up tests (experiments) to gather clues (data) to solve the mystery. You're always trying to be as fair and unbiased as possible to get the real story.
2. The Core Material
Scientific investigation isn't just one thing; it's a process involving several key skills. You'll usually start with an observation, form a question, make an educated guess (hypothesis), design an experiment, collect and analyse data, and finally draw conclusions.
Formulating Questions and Hypotheses

Photo by Ann H on Pexels
It all starts with a good question, often something you observe. For example, "Does sunlight affect how tall a plant grows?" A hypothesis is your testable prediction, based on what you already know or guess. For the plant example, it could be: "Plants exposed to more sunlight will grow taller than plants exposed to less sunlight." Your hypothesis needs to be specific and measurable.
Designing Experiments
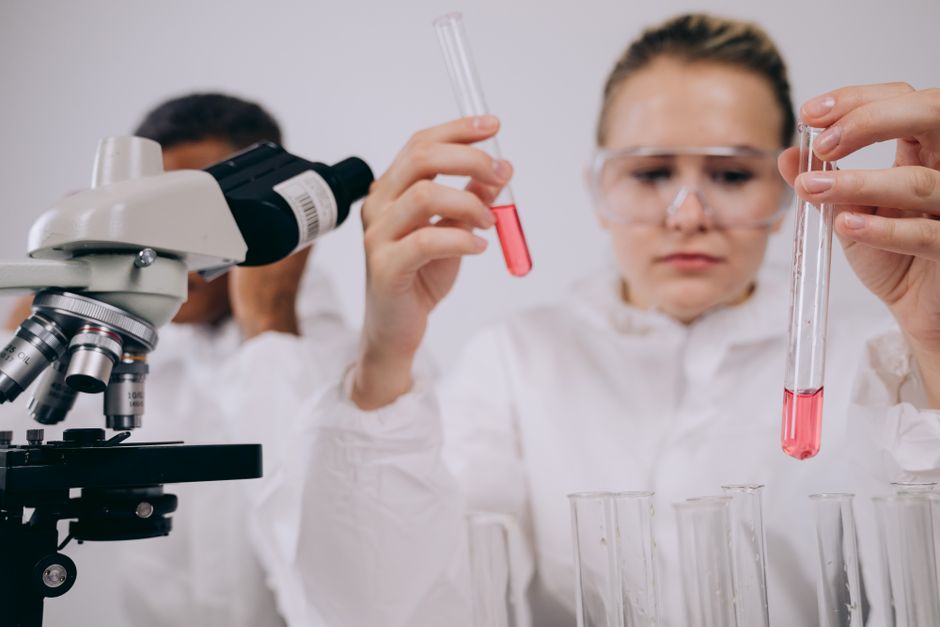
Photo by Mikhail Nilov on Pexels
This is crucial. A well-designed experiment helps ensure your results are reliable. Here's what you need to consider:
-
Variables:
- Independent Variable (IV): The one thing you change or manipulate. (e.g., amount of sunlight).
- Dependent Variable (DV): The thing you measure; it depends on the independent variable. (e.g., plant height).
- Controlled Variables: Everything else you keep exactly the same to ensure only the IV is affecting the DV. (e.g., type of plant, amount of water, soil type, temperature).
-
Control Group: A group in your experiment that doesn't receive the treatment (the independent variable). This gives you a baseline for comparison. For the plant example, it could be plants kept in complete darkness or under normal light conditions, depending on your question.
-
Repeated Trials: Doing the experiment multiple times with different subjects (e.g., several plants in each sunlight group) and taking multiple measurements helps ensure your results aren't just a fluke and increases their reliability.
graph TD
    A["Make an Observation"] --> B["Formulate a Question"]
    B --> C["Develop a Hypothesis (Testable Prediction)"]
    C --> D["Design an Experiment"]
    D --> E["Identify IV, DV, Controlled Variables"]
    E --> F["Establish Control Group (if applicable)"]
    F --> G["Conduct Experiment & Collect Data"]
    G --> H["Analyze Data (Look for Patterns)"]
    H --> I["Draw Conclusions (Support or Reject Hypothesis?)"]
    I --> J["Communicate Results"]
    J --> A;
Collecting and Presenting Data

Photo by Monstera Production on Pexels
Once your experiment is running, you need to collect data accurately and consistently. Use appropriate tools (rulers, scales, stopwatches) and record your measurements immediately. Data can be qualitative (observations like "leaves are green") or quantitative (numbers like "plant grew 5 cm").
Presenting data clearly makes it easier to understand. Tables are good for raw data, while graphs (bar charts, line graphs) help visualize trends.
Analyzing Data and Drawing Conclusions

Photo by Lukas Blazek on Pexels
After collecting data, you'll look for patterns and relationships. Does your data support your hypothesis, or does it contradict it? Your conclusion should directly address your hypothesis and explain what your data tells you. It's okay if your hypothesis isn't supported; that's still a valuable finding! Also, consider any limitations or sources of error in your experiment.
3. Worked Example
Let's say you want to find out if different brands of fertilizer affect the number of tomatoes a plant produces.
- Observation: You notice your neighbour's tomato plants look much healthier than yours.
- Question: Does Brand A fertilizer increase tomato yield more than Brand B fertilizer?
- Hypothesis: Tomato plants treated with Brand A fertilizer will produce significantly more tomatoes than plants treated with Brand B fertilizer or no fertilizer.
- Experiment Design:
- IV: Type of fertilizer (Brand A, Brand B, No fertilizer).
- DV: Number of ripe tomatoes produced per plant.
- Controlled Variables: Use the same type of tomato plant, same soil, same pots, same amount of water, same sunlight exposure, same temperature. All plants should be started at the same time and given fertilizer according to package directions.
- Control Group: A group of plants given no fertilizer.
- Procedure: Get 15 identical tomato plants. Divide them into three groups of five. Group 1 gets Brand A, Group 2 gets Brand B, Group 3 gets no fertilizer. Apply fertilizer as directed. Observe and count ripe tomatoes produced by each plant over the growing season.
- Data Collection: After the season, you collect the following data (simplified for this example):
| Group | Plant 1 | Plant 2 | Plant 3 | Plant 4 | Plant 5 | Average Tomatoes |
|---|---|---|---|---|---|---|
| Brand A | 15 | 14 | 16 | 15 | 15 | 15 |
| Brand B | 10 | 9 | 11 | 10 | 10 | 10 |
| No Fertilizer | 5 | 6 | 5 | 4 | 5 | 5 |
- Analysis and Conclusion:
- The average number of tomatoes was 15 for Brand A, 10 for Brand B, and 5 for the control group.
- Conclusion: The data supports the hypothesis. Brand A fertilizer resulted in significantly more tomatoes than Brand B fertilizer, and both fertilizers increased yield compared to no fertilizer. This suggests Brand A is more effective for tomato production under these conditions.
4. Key Takeaways
- Scientific investigation begins with an observation and a specific, testable question.
- Your hypothesis is a prediction you make about the outcome of your experiment.
- A well-designed experiment carefully controls all variables except the one you're testing (the independent variable).
- The dependent variable is what you measure to see the effect of your change.
- Always include a control group for comparison, if possible.
- Collect data accurately, record it clearly, and use tables or graphs to present it.
- Your conclusion should directly address your hypothesis based on your collected evidence.
- It's okay if your hypothesis isn't supported; learning why is part of the scientific process.
Common Mistakes to Avoid
- Changing more than one variable: If you change too many things at once, you won't know what caused your results.
- Not having enough trials/samples: A small sample size can lead to unreliable results. Repeat your experiment or test multiple subjects.
- Biased observations: Only seeing what you want to see. Be objective when collecting data.
- Drawing conclusions that aren't supported by data: Your conclusion must stem directly from your evidence, not just your initial guess.
5. Now Try It
Think about a common household problem or a simple observation you've made (e.g., "Which brand of paper towel absorbs the most liquid?" or "Does talking to plants really make them grow better?").
1. Formulate a specific question about it.
2. Write a testable hypothesis (your prediction).
3. Outline a simple experiment to test your hypothesis. Clearly identify your independent variable, dependent variable, and at least three controlled variables. Describe how you'd collect data.
Success looks like a clear question, a precise hypothesis, and an experimental design that logically tests only one thing at a time, with measurable outcomes and controlled conditions.
Frequently asked about Scientific Skills and Investigation
More from science
Get the full science curriculum
Clone the complete plan to your dashboard for unlimited AI-generated notes, practice quizzes, and a personalised revision schedule.
Save this course free