Quadratic Functions and Modeling
From the math curriculum
TL;DR
Quadratic functions create parabolas, U-shaped curves, and are defined by equations with an $x^2$ term. You can find key features like the vertex and intercepts to understand how they model real-world situations. These functions are super useful for optimizing things like projectile motion or revenue.
1. The Mental Model
Imagine throwing a ball or the path of water from a fountain; that arc is the shape a quadratic function makes. It's a smooth curve that goes up then down, or down then up, always with a single turning point. This turning point is often the maximum or minimum value in a real-world problem.
2. The Core Material
Quadratic functions are polynomial functions with the highest power of the variable being 2. They look like $f(x) = ax^2 + bx + c$, where 'a', 'b', and 'c' are constants and $a \neq 0$.
The Parabola
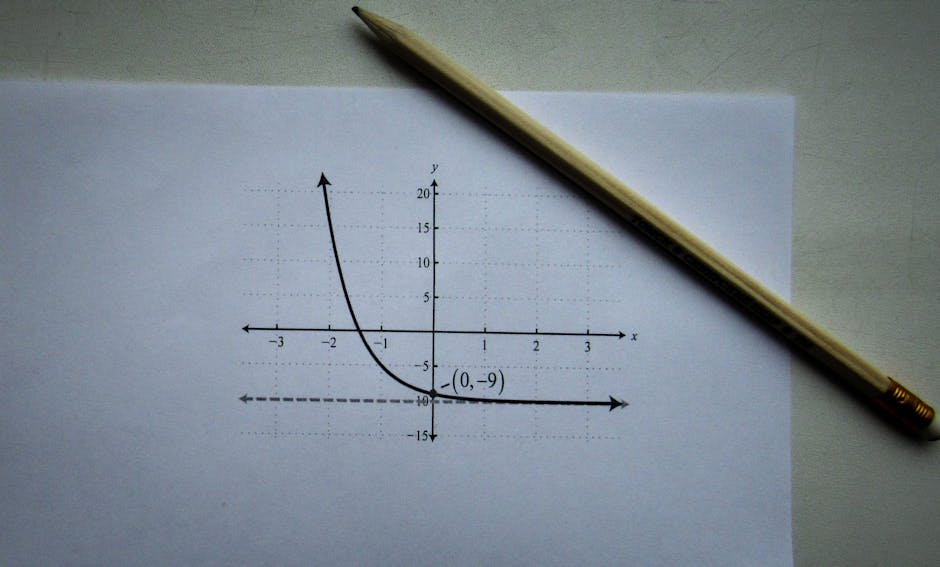
Photo by Sergey Meshkov on Pexels
The graph of a quadratic function is called a parabola.
- If $a > 0$, the parabola opens upwards, and the vertex is a minimum point.
- If $a < 0$, the parabola opens downwards, and the vertex is a maximum point.
Key Features of a Parabola
Photo by Sergey Meshkov on Pexels
Vertex
The vertex is the turning point of the parabola. Its coordinates are $(h, k)$.
You can find the x-coordinate of the vertex using the formula: $h = -\frac{b}{2a}$.
Once you have 'h', plug it back into the original function to find 'k': $k = f(h)$.
Axis of Symmetry
This is a vertical line that passes through the vertex, dividing the parabola into two symmetrical halves. Its equation is $x = h$.
Y-intercept
This is where the parabola crosses the y-axis. It occurs when $x = 0$. For $f(x) = ax^2 + bx + c$, the y-intercept is $(0, c)$.
X-intercepts (Roots/Zeros)
These are where the parabola crosses the x-axis, meaning $f(x) = 0$. You can find these by:
1. Factoring: If possible, factor the quadratic expression and set each factor to zero.
2. Quadratic Formula: Always works: $x = \frac{-b \pm \sqrt{b^2 - 4ac}}{2a}$.
3. Completing the Square: A method to convert the standard form into vertex form.
Vertex Form
Photo by Sergey Meshkov on Pexels
Sometimes it's easier to work with the vertex form of a quadratic function: $f(x) = a(x - h)^2 + k$.
Here, $(h, k)$ is directly the vertex, and 'a' tells you if it opens up or down and how wide or narrow it is.
Modeling Real-World Problems

Photo by Yan Krukau on Pexels
Quadratic functions are great for modeling situations where there's an optimal point (maximum or minimum). Examples include:
- Projectile motion (height over time).
- Maximizing area with a fixed perimeter.
- Maximizing revenue from sales.
graph TD
    A["Start with Quadratic Function: f(x) = ax² + bx + c"] --> B{Does 'a' > 0 or 'a' < 0?};
    B --> |'a' > 0| C["Parabola Opens Upwards"];
    B --> |'a' < 0| D["Parabola Opens Downwards"];
    C --> E["Vertex is a Minimum"];
    D --> E;
    E --> F["Find Vertex (h, k)"];
    F --> G["h = -b/(2a)"];
    F --> H["k = f(h)"];
    G --> I["Axis of Symmetry: x = h"];
    H --> J["Find Y-intercept: Set x = 0 (0, c)"];
    J --> K["Find X-intercepts: Set f(x) = 0"];
    K --> L{"Method for X-intercepts"};
    L --> M["Factoring"];
    L --> N["Quadratic Formula"];
    L --> O["Completing the Square"];
    O --> P["Graph the Parabola"];
    N --> P;
    M --> P;
3. Worked Example
Let's say a company's revenue $R(x)$ (in thousands of dollars) from selling $x$ units of a product is given by the function $R(x) = -0.5x^2 + 20x$. We want to find the number of units that maximizes revenue and what that maximum revenue is.
Here, $a = -0.5$, $b = 20$, and $c = 0$.
Since $a = -0.5 < 0$, the parabola opens downwards, so the vertex will be a maximum point.
-
Find the x-coordinate of the vertex (number of units):
$h = -\frac{b}{2a} = -\frac{20}{2(-0.5)} = -\frac{20}{-1} = 20$ units. -
Find the y-coordinate of the vertex (maximum revenue):
$k = R(20) = -0.5(20)^2 + 20(20)$
$k = -0.5(400) + 400$
$k = -200 + 400$
$k = 200$ (thousand dollars)
So, selling 20 units will maximize the revenue at $200,000.
4. Key Takeaways
- Quadratic functions $f(x) = ax^2 + bx + c$ always graph as parabolas.
- The sign of 'a' tells you if the parabola opens up ($a > 0$, minimum) or down ($a < 0$, maximum).
- The vertex $(h, k)$ is the parabola's turning point, found using $h = -b/(2a)$ and $k = f(h)$.
- The x-intercepts are where $f(x) = 0$, found by factoring or the quadratic formula.
- The y-intercept is $(0, c)$, found by setting $x = 0$.
- The axis of symmetry is the vertical line $x = h$, passing through the vertex.
- Quadratic functions are used to model problems involving maximums or minimums, like projectile motion or optimization.
Common Mistakes to Avoid:
- Forgetting the negative sign in the vertex formula $h = -b/(2a)$.
- Confusing the x-intercepts (where $y=0$) with the y-intercept (where $x=0$).
- Incorrectly calculating the discriminant ($b^2 - 4ac$) when using the quadratic formula, especially with negative numbers.
- Not paying attention to the sign of 'a' when determining if the vertex is a maximum or minimum.
5. Now Try It
A diver jumps from a springboard. Her height $h$ (in meters) above the water at time $t$ (in seconds) is given by $h(t) = -5t^2 + 10t + 3
Frequently asked about Quadratic Functions and Modeling
Study this next
Get the full math curriculum
Clone the complete plan to your dashboard for unlimited AI-generated notes, practice quizzes, and a personalised revision schedule.
Save this course free