Lecture et Interprétation Graphique de Fonctions
From the https://www.youtube.com/watch?v=BiihO1M8SAY&pp=ygUqZ2VuZXJhbGl0ZSBzdXIgbGVzIGZvbmN0aW9uIDNlbWUgdGVjaG5pcXVl curriculum
Lecture et Interprétation Graphique de Fonctions
TL;DR
Reading a function's graph helps you understand its behavior without needing its equation. You'll learn to find images, antecedents, variations, and signs directly from a visual representation. This skill is crucial for quickly grasping function properties in many mathematical contexts.
1. The Mental Model
Imagine a function's graph as a story told visually. Each point on the graph, (x, y), represents an input x and its corresponding output y. You're learning to "read" this story to understand what the function does.
2. The Core Material
When you look at a function's graph, you're essentially mapping inputs (on the x-axis) to outputs (on the y-axis) and vice versa.
Finding an Image (y-value) from an Antecedent (x-value)

Photo by Sergey Meshkov on Pexels
To find the image of a number x (what we call an antecedent):
1. Locate x on the x-axis (horizontal axis).
2. Move vertically from x until you hit the function's curve.
3. From that point on the curve, move horizontally to the y-axis (vertical axis).
4. The value you read on the y-axis is the image, f(x).
Finding Antecedents (x-values) from an Image (y-value)

Photo by Brett Jordan on Pexels
To find the antecedent(s) of a number y:
1. Locate y on the y-axis (vertical axis).
2. Move horizontally from y until you hit the function's curve. (You might hit it multiple times!)
3. From each point on the curve, move vertically to the x-axis (horizontal axis).
4. The value(s) you read on the x-axis are the antecedents for y.
Determining the Variation (Increasing/Decreasing)
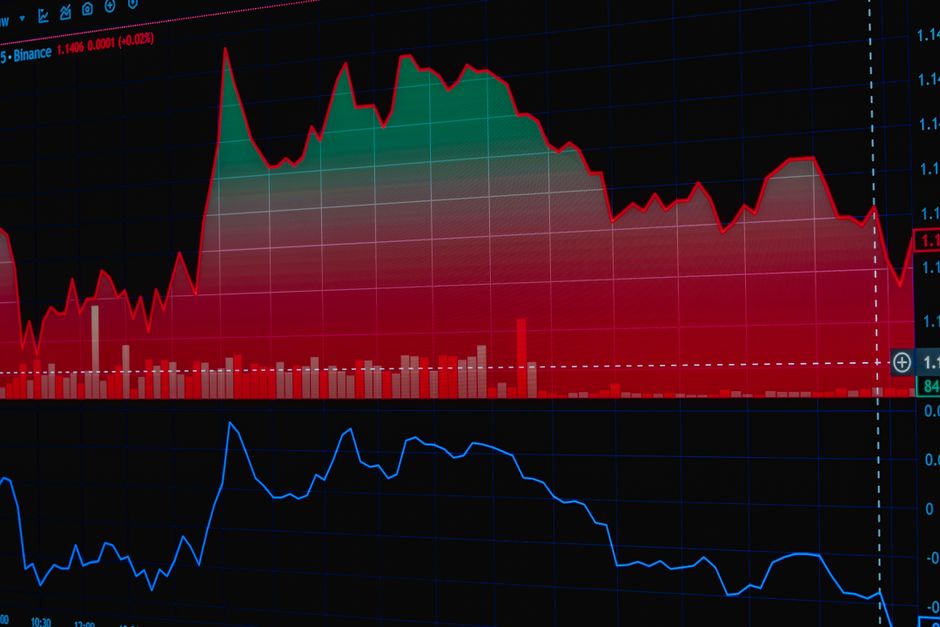
Photo by Rafael Minguet Delgado on Pexels
A function's variation describes whether it's going up or down.
* Increasing: As x moves right, the curve goes up (like climbing a hill). f(x_1) < f(x_2) for x_1 < x_2.
* Decreasing: As x moves right, the curve goes down (like descending a valley). f(x_1) > f(x_2) for x_1 < x_2.
* Constant: As x moves right, the curve stays flat. f(x_1) = f(x_2) for x_1 < x_2.
Determining the Sign (Positive/Negative)

Photo by Alex Koch on Pexels
The sign of f(x) tells you if the function's output is positive, negative, or zero.
* Positive: The curve is above the x-axis (f(x) > 0).
* Negative: The curve is below the x-axis (f(x) < 0).
* Zero: The curve crosses or touches the x-axis (f(x) = 0). These points are called roots or x-intercepts.
Here's how you can visualize the process:
graph TD
    A["Start with a Function's Graph"] --> B{"What do you need?"}

    B --> C{{"Find f(x) for a given x (Image)?"}}
    C --> C1["Locate x on x-axis"]
    C1 --> C2["Move vertically to curve"]
    C2 --> C3["Move horizontally to y-axis"]
    C3 --> C4["Read y-value (f(x))"]

    B --> D{{"Find x for a given f(x) (Antecedent(s))?"}}
    D --> D1["Locate f(x) on y-axis"]
    D1 --> D2["Move horizontally to curve"]
    D2 --> D3["Move vertically to x-axis"]
    D3 --> D4["Read x-value(s)"]

    B --> E{{"Determine Variation (Increasing/Decreasing)?"}}
    E --> E1["Scan curve from left to right"]
    E1 --> E2{"Is curve going up or down?"}
    E2 --> E3["Up = Increasing"]
    E2 --> E4["Down = Decreasing"]

    B --> F{{"Determine Sign (Positive/Negative)?"}}
    F --> F1["Observe curve's position relative to x-axis"]
    F1 --> F2{"Is curve above or below x-axis?"}
    F2 --> F3["Above = Positive (f(x) > 0)"]
    F2 --> F4["Below = Negative (f(x) < 0)"]
    F2 --> F5["On x-axis = Zero (f(x) = 0)"]
3. Worked Example
Let's say you have a graph of a function f that looks like a parabola opening downwards, with its peak at (0, 4) and crossing the x-axis at (-2, 0) and (2, 0).
-
Find
f(1):- Locate
x = 1on the x-axis. - Go up to the curve.
- Go left to the y-axis. You'd read
y = 3. So,f(1) = 3.
- Locate
-
Find the antecedent(s) of
y = 0:- Locate
y = 0on the y-axis (this is the x-axis). - Go horizontally to the curve. It hits at
x = -2andx = 2. - So, the antecedents of
0are-2and2.
- Locate
-
Determine variation:
- From
x = -infinitytox = 0, the curve goes up. So,fis increasing on(-infinity, 0). - From
x = 0tox = +infinity, the curve goes down. So,fis decreasing on(0, +infinity).
- From
-
Determine sign:
- Between
x = -2andx = 2, the curve is above the x-axis. So,f(x)is positive on(-2, 2). - Before
x = -2and afterx = 2, the curve is below the x-axis. So,f(x)is negative on(-infinity, -2)and(2, +infinity). - At
x = -2andx = 2,f(x)is zero.
- Between
4. Key Takeaways
- The x-axis represents inputs (antecedents), and the y-axis represents outputs (images).
- To find an image
f(x), start atxon the x-axis, go vertically to the curve, then horizontally to the y-axis. - To find antecedents for a
y, start atyon the y-axis, go horizontally to the curve (you might hit it multiple times), then vertically to the x-axis. - A function is increasing when its curve goes up from left to right, and decreasing when it goes down.
- A function is positive when its curve is above the x-axis, negative when below, and zero when it crosses or touches the x-axis.
- Pay attention to where the graph starts and ends (domain and range) as these affect your answers.
- The minimum and maximum points of a function are where its variation changes direction.
Common Mistakes to Avoid:
- Confusing x and y axes: Always remember x is horizontal, y is vertical.
- Reading antecedents incorrectly: If you're looking for antecedents, you might find more than one x-value for a single y-value.
- Misinterpreting signs: Don't confuse "increasing/decreasing" with "positive/negative." An increasing function can still be negative.
- Ignoring the domain: Your answers should only be within the defined range of the x-values shown on the graph.
5. Now Try It
Grab a graph of any continuous function (you can sketch one yourself, or find one online). For this graph, take three different x-values and find their images. Then, pick two different y-values and find all their antecedents. Finally, describe the intervals where the function is increasing/decreasing and where it is positive/negative.
Success looks like: You can confidently state f(x) for any x on the graph, list all x for a given f(x), and accurately map out where the function's curve is going up/down and where it is above/below the x-axis.
Frequently asked about Lecture et Interprétation Graphique de Fonctions
More from https://www.youtube.com/watch?v=BiihO1M8SAY&pp=ygUqZ2VuZXJhbGl0ZSBzdXIgbGVzIGZvbmN0aW9uIDNlbWUgdGVjaG5pcXVl
Get the full https://www.youtube.com/watch?v=BiihO1M8SAY&pp=ygUqZ2VuZXJhbGl0ZSBzdXIgbGVzIGZvbmN0aW9uIDNlbWUgdGVjaG5pcXVl curriculum
Clone the complete plan to your dashboard for unlimited AI-generated notes, practice quizzes, and a personalised revision schedule.
Create Free Account