Financial Statement Analysis and Management's Role
From the https://openstax.org/books/principles-financial-accounting/pages/1-why-it-matters curriculum
TL;DR
Financial statement analysis helps you understand a company's past performance and future potential using its financial reports. Management plays a crucial role in preparing these statements and ensuring their accuracy and transparency. Analyzing these statements allows investors and creditors to make informed decisions about allocating resources.
1. The Mental Model
Think of financial statements as a company's report card, and financial analysis as your way of grading that report card. Management is like the student who prepared the report card, aiming to present the company's story accurately and responsibly.
2. The Core Material
Financial statement analysis is essentially looking at a company's financial reports – the Income Statement, Balance Sheet, and Statement of Cash Flows – to evaluate its financial health and performance. You're trying to spot trends, compare the company to its competitors, and assess its ability to meet its obligations and grow.
There are a few key approaches you'll use:
Horizontal Analysis (Trend Analysis)
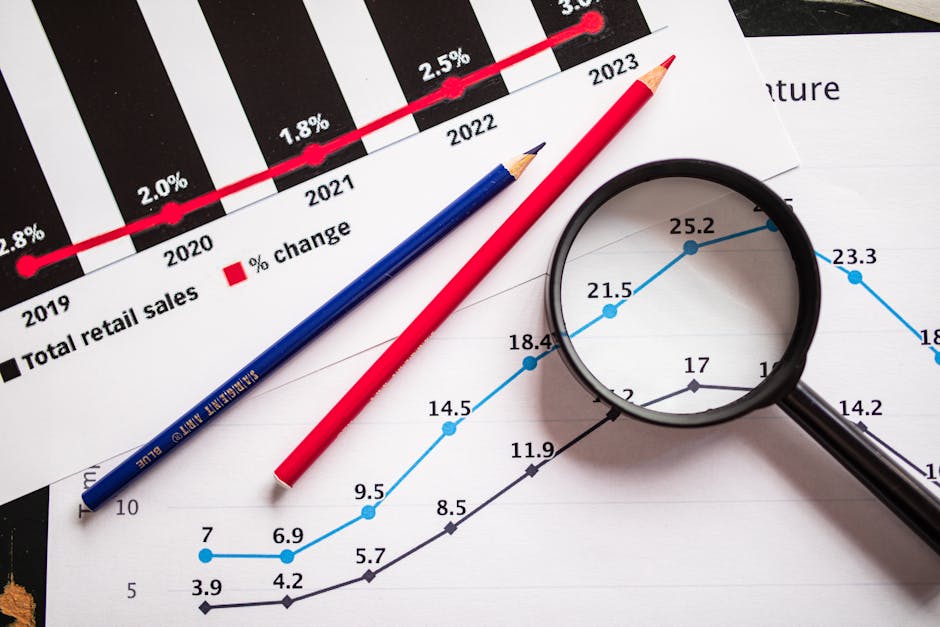
Photo by RDNE Stock project on Pexels
This involves comparing financial data over several periods (e.g., year over year) to identify trends. You're looking for increases or decreases in revenue, expenses, assets, or liabilities.
For example, if sales revenue increased by 10% this year compared to last, that's a positive trend.
Vertical Analysis (Common-Size Analysis)

Photo by Hanna Pad on Pexels
Here, you express each line item in a financial statement as a percentage of a base amount.
* Income Statement: Each item is a percentage of total revenue. This shows you how much of each sales dollar goes to cost of goods sold, operating expenses, and profit.
* Balance Sheet: Each item is a percentage of total assets. This helps you understand the composition of assets and liabilities.
This allows for easy comparison between companies of different sizes or over time for the same company, as it normalizes the data.
Ratio Analysis

Photo by Yan Krukau on Pexels
This is where you calculate various ratios using numbers from the financial statements. Ratios are powerful because they distill complex financial information into easily understandable metrics. They generally fall into these categories:
- Liquidity Ratios: Measure a company's ability to meet short-term obligations (e.g., Current Ratio, Quick Ratio).
- Solvency Ratios: Measure a company's ability to meet long-term obligations (e.g., Debt-to-Assets Ratio, Times Interest Earned).
- Profitability Ratios: Measure a company's ability to generate earnings (e.g., Net Profit Margin, Return on Assets, Return on Equity).
- Efficiency Ratios: Measure how effectively a company uses its assets (e.g., Inventory Turnover, Accounts Receivable Turnover).
Management's Role

Photo by Ann Hannes on Pexels
Management's role is absolutely critical. They're responsible for:
- Preparing the Financial Statements: This includes ensuring they follow Generally Accepted Accounting Principles (GAAP) or International Financial Reporting Standards (IFRS).
- Internal Controls: Implementing systems and procedures to safeguard assets and ensure the accuracy and reliability of financial data.
- Transparency and Disclosure: Providing clear and comprehensive information in the financial statements and accompanying notes, which are vital for users to make informed decisions.
- Ethical Conduct: Upholding ethical standards to prevent fraud and misrepresentation. Management's integrity directly impacts the credibility of the financial statements.
Here's a breakdown of how management's actions influence financial reporting and analysis:
graph TD
    A["Management's Decisions & Actions"] --> B{"Accounting System & Controls"};
    B --> C["Data Collection & Recording"];
    C --> D{"Preparation of Financial Statements"};
    D --> E["Auditor Review"];
    E --> F["External Financial Statements"];
    F --> G["Financial Statement Analysis"];
    G --> H["Investor/Creditor Decisions"];
    H --> I["Impact on Company"];
    D -- "Ensuring GAAP/IFRS Compliance" --> E;
    A -- "Ethical Tone" --> B;
    A -- "Strategic Choices" --> F;
3. Worked Example
Let's do a quick vertical analysis on a simplified Income Statement for Company X for 2023.
Company X - Income Statement (Simplified) - 2023
| Account | Amount ($) |
|---|---|
| Sales Revenue | 1,000,000 |
| Cost of Goods Sold (COGS) | 400,000 |
| Gross Profit | 600,000 |
| Operating Expenses | 250,000 |
| Operating Income | 350,000 |
| Interest Expense | 50,000 |
| Income Before Taxes | 300,000 |
| Income Tax Expense | 75,000 |
| Net Income | 225,000 |
To perform vertical analysis, we'll express each line item as a percentage of Sales Revenue (our base amount, $1,000,000).
Company X - Common-Size Income Statement (Simplified) - 2023
| Account | Amount (
Frequently asked about Financial Statement Analysis and Management's Role
Study this next
Get the full https://openstax.org/books/principles-financial-accounting/pages/1-why-it-matters curriculum
Clone the complete plan to your dashboard for unlimited AI-generated notes, practice quizzes, and a personalised revision schedule.
Save this course free