Introduction to Inequalities and Graphing
From the Solving equations and inequalities Algebra 1 curriculum
TL;DR
Inequalities compare quantities that aren't necessarily equal using symbols like $ < $ or $ \ge $. You can solve inequalities much like equations, but be careful when multiplying or dividing by negative numbers. Graphing inequalities on a number line helps you visualize all the solutions a problem might have.
1. The Mental Model
Think of inequalities as a scale that isn't perfectly balanced; one side is heavier or lighter than the other. When you solve them, you're trying to figure out what values make that scale tip in a particular direction. Graphing shows you all those tipping points.
2. The Core Material
When we talk about inequalities, we're dealing with relationships between numbers that aren't strictly equal. Instead, one quantity might be greater than, less than, greater than or equal to, or less than or equal to another.
Here are the basic inequality symbols:
* $ < $ : less than (e.g., $ 3 < 5 $)
* $ > $ : greater than (e.g., $ 7 > 2 $)
* $ \le $ : less than or equal to (e.g., $ 4 \le 4 $, $ 4 \le 6 $)
* $ \ge $ : greater than or equal to (e.g., $ 9 \ge 9 $, $ 9 \ge 5 $)
* $ \ne $ : not equal to (e.g., $ 5 \ne 8 $)
Solving Inequalities

Photo by Vanessa Garcia on Pexels
Solving an inequality is very similar to solving an equation. You use inverse operations to isolate the variable.
The Golden Rule: The only major difference is that if you multiply or divide both sides of an inequality by a negative number, you must flip the direction of the inequality sign.
Let's see why:
Start with a true statement: $ 2 < 5 $
Multiply by $ -1 $: $ 2 \times (-1) $ and $ 5 \times (-1) $
This gives us $ -2 $ and $ -5 $.
Is $ -2 < -5 $? No! $ -2 $ is greater than $ -5 $.
So, we must flip the sign: $ -2 > -5 $.
Graphing Inequalities on a Number Line
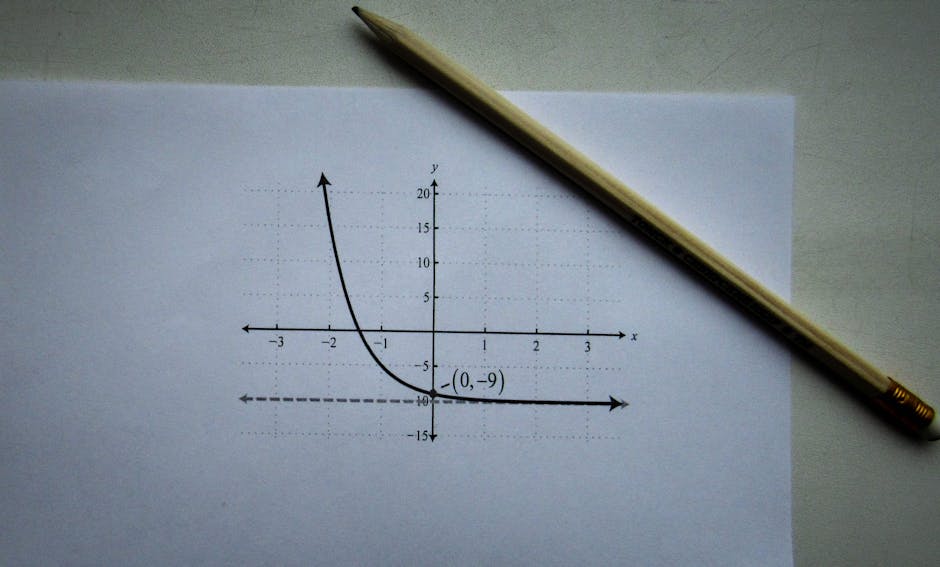
Photo by Sergey Meshkov on Pexels
A number line is a great way to show all possible solutions to an inequality.
Here's how to graph them:
- Draw a number line: Include zero and a few numbers in both positive and negative directions.
- Mark the critical point: This is the number from your inequality (e.g., if it's $ x > 3 $, the critical point is 3).
- Use an open or closed circle:
- Open circle $ \circ $: If the inequality is $ < $ or $ > $. This means the critical point itself is not a solution.
- Closed circle $ \bullet $: If the inequality is $ \le $ or $ \ge $. This means the critical point is a solution.
- Draw an arrow:
- If the variable is greater than ($ > $ or $ \ge $), the arrow points to the right (towards larger numbers).
- If the variable is less than ($ < $ or $ \le $), the arrow points to the left (towards smaller numbers).
Here’s a diagram to help you remember the graphing rules:
graph TD
    A["Start with an inequality (e.g., x > 3)"] --> B{Check the inequality symbol};

    B -- ">" or "<" --> C["Use an OPEN circle (o) on the critical number"];
    B -- ">=" or "<=" --> D["Use a CLOSED circle (•) on the critical number"];

    C --> E{Which direction?};
    D --> E{Which direction?};

    E -- "Variable > Number" --> F["Draw arrow to the RIGHT"];
    E -- "Variable < Number" --> G["Draw arrow to the LEFT"];
3. Worked Example
Let's solve and graph the inequality: $ -2x + 5 \ge 13 $
-
Subtract 5 from both sides:
$ -2x + 5 - 5 \ge 13 - 5 $
$ -2x \ge 8 $ -
Divide by -2 (and remember to flip the sign!):
$ \frac{-2x}{-2} \le \frac{8}{-2} $
$ x \le -4 $ -
Graph on a number line:
- The critical point is $ -4 $.
- Since it's $ \le $, we use a closed circle at $ -4 $.
- Since $ x $ is less than or equal to $ -4 $, the arrow points to the left.
<-----|-----|-----|-----•-----|-----|-----|-----|----->
     -7    -6    -5    -4    -3    -2    -1     0
4. Key Takeaways
- Inequalities show a relationship where quantities aren't necessarily equal.
- The four main inequality symbols are $ < $, $ > $, $ \le $, and $ \ge $.
- Solving inequalities is just like solving equations, using inverse operations.
- Crucially, flip the inequality sign when multiplying or dividing by a negative number.
- Graphing uses open circles for $ < $ or $ > $ and closed circles for $ \le $ or $ \ge $.
- An arrow points right for "greater than" and left for "less than".
- The graph visually represents all the numbers that make the inequality true.
Common Mistakes to Avoid

Photo by KATRIN BOLOVTSOVA on Pexels
- Forgetting to flip the inequality sign when multiplying or dividing by a negative.
- Confusing open and closed circles on the number line.
- Drawing the arrow in the wrong direction on the number line.
- Thinking that $ x < 3 $ means $ x $ can only be whole numbers like $ 2, 1, 0 $. It can also be $ 2.5 $ or $ -100 $.
5. Now Try It
Solve the inequality $ 7 - 3y < 16 $. Once you have your solution for $ y $, graph it on a number line.
Success looks like: You should have an inequality for $ y $ and a number line with the correct circle (open or closed) and the correct arrow direction.
Frequently asked about Introduction to Inequalities and Graphing
Study this next
Get the full Solving equations and inequalities Algebra 1 curriculum
Clone the complete plan to your dashboard for unlimited AI-generated notes, practice quizzes, and a personalised revision schedule.
Save this course free