Introduction to Functions and Linear Functions Basics
From the Topic covered: Linear function Quadratic function Properties of parabola curriculum
Introduction to Functions and Linear Functions Basics
TL;DR
Functions describe how one quantity depends on another, transforming inputs into unique outputs. Linear functions are the simplest type, showing a constant rate of change and producing a straight line when graphed. You'll learn to identify functions, understand their components, and work with basic linear equations.
1. The Mental Model
Think of a function like a reliable machine: you put something in, and it consistently spits out one specific thing based on what you put in. A linear function is just a very simple version of this machine where the output changes steadily with every input.
2. The Core Material
What is a Function?

Photo by Ann H on Pexels
A function is a relationship where each input has exactly one output. It's like a rule that tells you what to do with a number to get another number. We often write functions using "f(x)" (read as "f of x"), where 'x' is the input and 'f(x)' is the output.
Identifying Functions
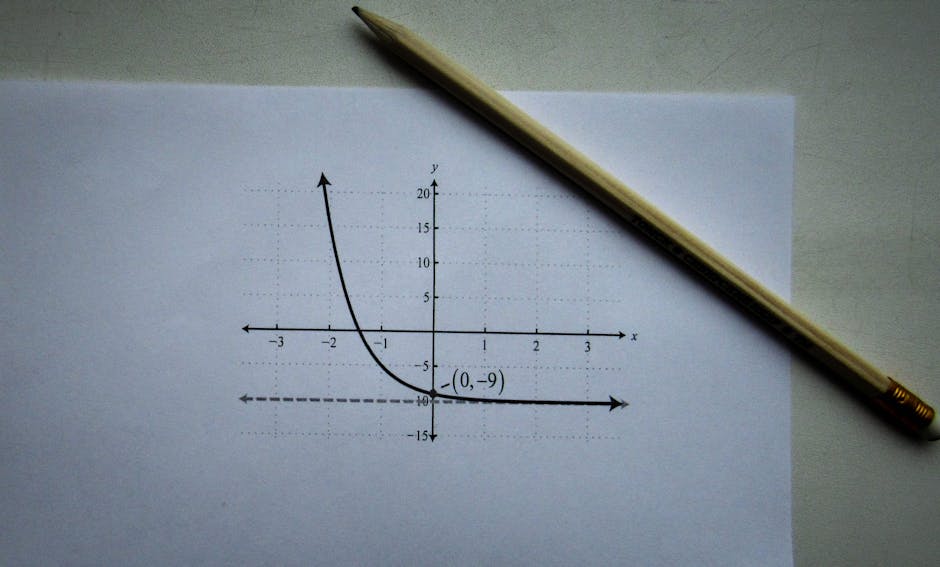
Photo by Sergey Meshkov on Pexels
Not every relationship is a function. If you put the same input into a machine and sometimes get one output and sometimes get a different one, it's not a function.
graph TD
    A["Input (x)"] --> B{{"Function Rule f"}}
    B --> C["Output f(x)"]
    C --> D{"Is there ONLY ONE Output for each Input?"}
    D -- "Yes" --> E["It's a Function!"]
    D -- "No" --> F["Not a Function"]
Domain and Range
Photo by Sergey Meshkov on Pexels
- Domain: All the possible input values (x-values) you can put into a function.
- Range: All the possible output values (f(x) or y-values) you get from the function.
Introduction to Linear Functions

Photo by Ann H on Pexels
A linear function is a specific type of function where the graph is always a straight line. The defining characteristic is a constant rate of change, meaning the output changes by the same amount for every unit change in the input.
The most common form for a linear function is the slope-intercept form:
y = mx + b or f(x) = mx + b
- m is the slope. It tells you how steep the line is and its direction (up or down). It's the "rise over run" – the change in y divided by the change in x. A positive slope means the line goes up from left to right; a negative slope means it goes down.
- b is the y-intercept. This is the point where the line crosses the y-axis. It's the value of y when x is 0.
Calculating Slope
If you have two points on a line, (x1, y1) and (x2, y2), you can find the slope 'm' using this formula:
m = (y2 - y1) / (x2 - x1)
Graphing a Linear Function
You only need two points to draw a straight line.
1. Plot the y-intercept (0, b).
2. Use the slope (m) to find a second point. From the y-intercept, go "rise" units up or down (depending on the sign of m) and "run" units right.
3. Draw a straight line connecting these two points.
3. Worked Example
Let's work with the linear function f(x) = 2x + 3.
-
Identify the slope and y-intercept:
- Slope (m) = 2
- Y-intercept (b) = 3 (meaning the point (0, 3))
-
Find another point using the slope:
The slopem = 2can be written as2/1. This means for every 1 unit you move to the right on the x-axis, the y-value increases by 2 units.- Starting from our y-intercept (0, 3):
- Move 1 unit right (x becomes 0 + 1 = 1).
- Move 2 units up (y becomes 3 + 2 = 5).
- So, a second point on the line is (1, 5).
- Starting from our y-intercept (0, 3):
-
Graphing (mental picture): You'd plot (0, 3) and (1, 5) and then draw a straight line through them. This line would be going upwards from left to right because the slope is positive.
4. Key Takeaways
- A function assigns exactly one output to each input.
- The domain is all possible inputs; the range is all possible outputs.
- Linear functions have a constant rate of change and graph as a straight line.
- The slope (
m) tells you the steepness and direction of a linear function. - The y-intercept (
b) is where the line crosses the y-axis (when x=0). - You can graph a linear function by plotting the y-intercept and using the slope to find another point.
Common mistakes to avoid:
- Don't confuse input with output; f(x) is the output for a given x input.
- Make sure to check if a relation truly gives only one output per input before calling it a function.
- Forgetting that a negative slope means the line goes downwards from left to right.
- Incorrectly calculating the slope by mixing up the x and y coordinates or their order.
5. Now Try It
Graph the linear function y = -1/2x + 4. Identify its slope and y-intercept, then find two points and draw the line. What's the output when the input is x = 6?
Frequently asked about Introduction to Functions and Linear Functions Basics
Study this next
Get the full Topic covered: Linear function Quadratic function Properties of parabola curriculum
Clone the complete plan to your dashboard for unlimited AI-generated notes, practice quizzes, and a personalised revision schedule.
Create Free Account