Introduction to Data and Information
From the it curriculum
Introduction to Data and Information
TL;DR
Data is raw, unorganized facts, while information is data that's been processed and given meaning. Understanding this difference is crucial because we transform data into information to make better decisions. Effectively working with data and information helps you solve problems and gain insights.
1. The Mental Model
Think of data as individual ingredients from your fridge – a tomato, some lettuce, a piece of cheese. Information is what happens when you combine those ingredients into something meaningful, like a delicious salad.
2. The Core Material
You hear "data" and "information" used a lot, sometimes interchangeably, but they're not the same. It's important to know the difference because all the useful things we do in IT, from building apps to analyzing trends, rely on transforming raw data into meaningful information.
What is Data?

Photo by Efrem Efre on Pexels
Data is just raw, unorganized facts, figures, symbols, or observations. It has no inherent meaning on its own. It's simply a collection of unprocessed details.
Examples of data:
* 25
* "New York"
* "2023-10-26"
* "john.doe@example.com"
* A photograph file
* A sound recording
What is Information?

Photo by Ann H on Pexels
Information is data that has been processed, organized, structured, or presented in a given context to make it useful or meaningful. It answers questions, helps make decisions, and provides insights.
Examples of information derived from the data above:
* "The customer's age is 25."
* "John Doe, who lives in New York, registered on October 26, 2023."
* A sales report showing 25 units sold in "New York" on "2023-10-26".
* A graph showing customer demographics.
The key idea is that information adds context and value to data. It's the meaning we extract from data.
The Data-Information Cycle
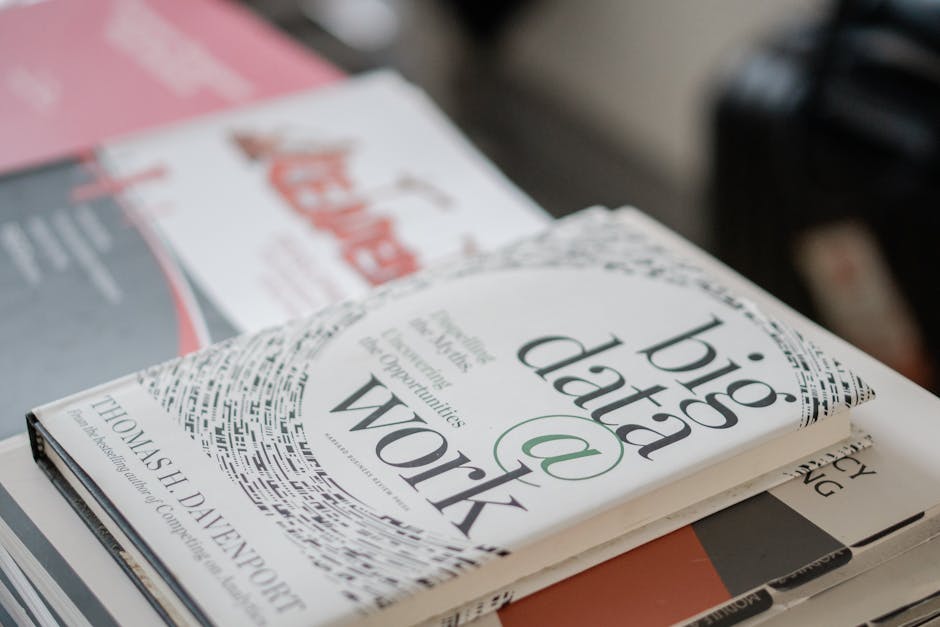
Photo by Asad Photo Maldives on Pexels
The process of turning data into information often follows a cycle. We collect data, process it, use it as information, and then that information might lead to new data collection or insights.
graph TD
    A["Collect Raw Data (e.g., sensor readings, customer input)"] --> B["Process Data (e.g., sort, filter, calculate, analyze)"]
    B --> C["Organize & Present Information (e.g., reports, dashboards, summaries)"]
    C --> D["Use Information (e.g., make decisions, gain insights)"]
    D --> A;
In IT, this cycle is fundamental. Databases store data, applications process it, and dashboards or reports present it as information for users.
3. Worked Example
Let's say you're running a small online store. You collect a lot of raw data from each order.
Raw Data Collected for one order:
* Order ID: 1001
* Product Name: "T-shirt"
* Quantity: 2
* Price per unit: 15.00
* Customer ID: CUST005
* Order Date: "2023-10-25"
* City: "London"
This is just a list of facts. On its own, it doesn't tell you much beyond what one customer bought.
Processing this data to get Information:
- Calculate Total Price:
Quantity * Price per unit = 2 * 15.00 = 30.00 - Associate with Customer: Find
CUST005in your customer database and retrieve their name, e.g., "Alice Smith". - Summarize Sales: Combine this order's total with other orders.
Information derived:
"On October 25, 2023, Alice Smith (customer CUST005) from London purchased 2 T-shirts for a total of
Frequently asked about Introduction to Data and Information
Get the full it curriculum
Clone the complete plan to your dashboard for unlimited AI-generated notes, practice quizzes, and a personalised revision schedule.
Create Free Account