Introduction to Kinematics: Describing Motion
From the General Physics 211 curriculum
Introduction to Kinematics: Describing Motion
TL;DR
Kinematics describes how things move without asking why — using position, velocity, and acceleration. You'll learn to tell the difference between distance and displacement, speed and velocity, and read motion graphs like a story. By the end, you can predict where and how fast something moves using three core equations.
1. The Mental Model
Motion is just position changing over time — everything else is bookkeeping on that idea. Velocity tells you how fast position changes; acceleration tells you how fast velocity changes. Nothing here cares about forces or mass, only about the geometry of movement. If you can graph position versus time, you already understand the physics — the equations just make it precise.
2. The Core Material
2.1 Position, Displacement, and Distance

Photo by Pixabay on Pexels
Position, $x$, is where an object is relative to some chosen origin. It's a single number on a number line (in 1D) — could be negative.
Displacement ($\Delta x$) is the change in position:
$$\Delta x = x_f - x_i$$
It only cares about start and end points, not the path taken. It's a vector — direction matters, so it can be negative.
Distance is the total length of the path traveled — always positive, and always ≥ |displacement|.
Example: you walk 3 m east, then 3 m west. Distance traveled = 6 m. Displacement = 0 m. They're not the same thing, and mixing them up is the single most common kinematics mistake.
2.2 Velocity vs. Speed
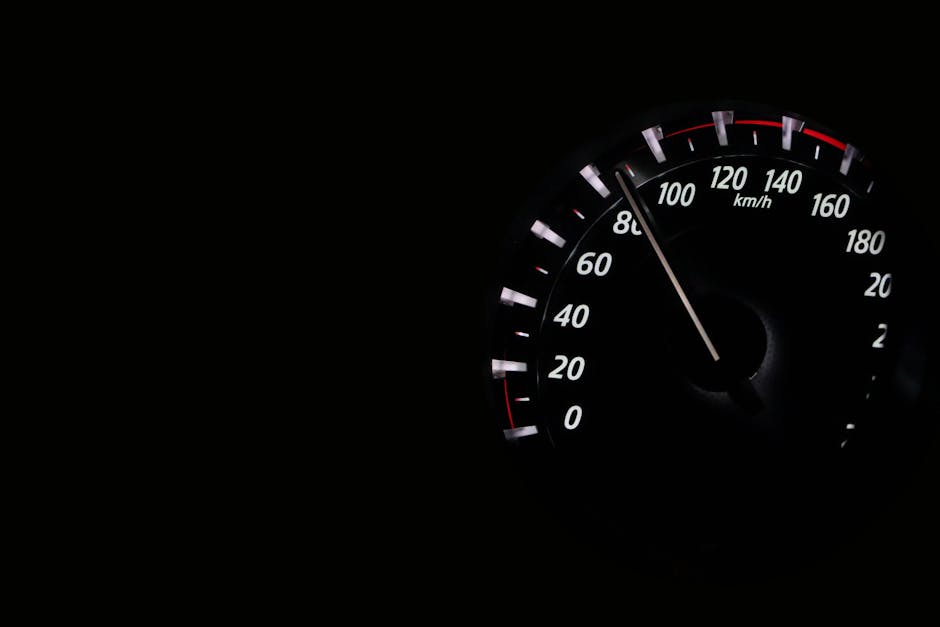
Photo by Pixabay on Pexels
Average velocity is displacement over time:
$$\bar{v} = \frac{\Delta x}{\Delta t}$$
Average speed is distance over time — always positive.
Instantaneous velocity is what a speedometer-like reading would show at one exact moment — the slope of the position-time graph at that instant:
$$v = \lim_{\Delta t \to 0} \frac{\Delta x}{\Delta t} = \frac{dx}{dt}$$
This is the same idea as a derivative in calculus: velocity is the rate of change of position.
2.3 Acceleration
Acceleration is the rate of change of velocity:
$$a = \frac{dv}{dt}$$
Constant acceleration is the workhorse case in intro physics — it lets you use the kinematic equations. If acceleration $a$ is constant, initial velocity is $v_0$, initial position is $x_0$, then:
$$v = v_0 + at$$
$$x = x_0 + v_0 t + \frac{1}{2}at^2$$
$$v^2 = v_0^2 + 2a(x - x_0)$$
These three equations are just algebra derived from the definitions above — no new physics, just consequences of "constant acceleration." You pick whichever equation has the variables you know and the one you want, and solve.
Sign convention matters enormously. Pick a positive direction once (say, "right is positive" or "up is positive") and stick with it for the entire problem. A decelerating object moving in the positive direction has negative acceleration — deceleration is not a separate concept, it's just acceleration opposite to velocity.
2.4 Reading Motion Graphs

Photo by Leeloo The First on Pexels
This is where kinematics becomes visual instead of algebraic.
- Position-time graph: slope = velocity. A flat line means zero velocity (object at rest). A straight sloped line means constant velocity. A curve means acceleration — the curve's steepness is changing.
- Velocity-time graph: slope = acceleration. Area under the curve = displacement.
- Acceleration-time graph: area under the curve = change in velocity.
This "slope and area" relationship is the same one connecting position, velocity, and acceleration through calculus (derivatives going up, integrals going down).
flowchart TD
    A["Position x(t)"] -->|"slope = dx/dt"| B["Velocity v(t)"]
    B -->|"slope = dv/dt"| C["Acceleration a(t)"]
    C -->|"area under curve"| B
    B -->|"area under curve"| A
A common trap: students assume a steep position-time graph means high acceleration. It doesn't — steepness there means high velocity. Acceleration only shows up as curvature on a position-time graph, or as slope on a velocity-time graph.
3. Worked Example
A car starts at rest ($v_0 = 0$) at position $x_0 = 0$ and accelerates at a constant $a = 2.5\ \text{m/s}^2$ for $6$ seconds. Then find:
(a) its velocity at $t = 6$ s,
(b) how far it has traveled,
(c) its velocity when it has traveled 50 m.
Set up: positive direction = direction of travel. Known: $v_0 = 0$, $a = 2.5\ \text{m/s}^2$.
(a) Velocity at t = 6 s
Use $v = v_0 + at$:
$$v = 0 + (2.5)(6) = 15\ \text{m/s}$$
(b) Distance traveled in 6 s
Use $x = x_0 + v_0 t + \frac{1}{2}at^2$:
$$x = 0 + 0 + \frac{1}{2}(2.5)(6)^2 = \frac{1}{2}(2.5)(36) = 45\ \text{m}$$
So after 6 seconds, the car has gone 45 m and is moving at 15 m/s.
(c) Velocity after traveling 50 m
Here we don't know $t$, so use the equation without time:
$$v^2 = v_0^2 + 2a(x - x_0)$$
$$v^2 = 0 + 2(2.5)(50) = 250$$
$$v = \sqrt{250} \approx 15.8\ \text{m/s}$$
Notice this happens after $t = 6$ s (since at 6 s it had only gone 45 m, not 50 m) — consistent with the fact that it's still accelerating and needs a bit more time and distance to reach 15.8 m/s.
Sanity check: does (b) make sense with (a)? Average velocity over the 6 s should be $(0 + 15)/2 = 7.5$ m/s (true for constant acceleration since velocity increases linearly). Distance = average velocity × time = $7.5 \times 6 = 45$ m. ✓ Matches part (b) exactly — a great way to double-check any constant-acceleration problem.
4. Key Takeaways
4.1 Most Important Concepts

Photo by Roxanne Minnish on Pexels
- Displacement ≠ distance. Displacement is a vector (can be negative, measures net change); distance is always positive and measures total path length.
- Velocity is the slope of position vs. time; acceleration is the slope of velocity vs. time. This graphical relationship is often more useful for intuition than the equations themselves.
- The three kinematic equations only work when acceleration is constant. If acceleration changes, you need calculus (integration) or numerical methods instead.
- Sign convention is not optional. Choose a positive direction before you start, and every velocity, displacement, and acceleration in the problem must respect it.
- "Deceleration" isn't a distinct physical quantity. It's just acceleration pointing opposite to the velocity — always work with signed acceleration, not the word "slowing down."
- Area under a velocity-time graph gives displacement, and area under an acceleration-time graph gives change in velocity — this is the graphical version of integration.
- At maximum height or a turning point, velocity is zero but acceleration usually isn't (a thrown ball has $a = -g$ the whole time, even at its peak).
4.2 Common Misconceptions
- "If velocity is zero, acceleration must be zero too." False — a ball thrown straight up has zero velocity at the top but constant downward acceleration ($-9.8\ \text{m/s}^2$) throughout its flight.
- "Negative acceleration always means slowing down." False — it means acceleration points in the negative direction. If velocity is already negative, negative acceleration makes the object speed up (moving faster in the negative direction).
- "A steeper position-time graph means greater acceleration." False — steepness on a position-time graph is velocity. Acceleration shows up as curvature, not slope, on that graph.
- "Distance and displacement are basically the same for most problems." Only true if the object never reverses direction. Any round trip or back-and-forth motion makes them diverge sharply.
4.3 Compare & Contrast
| Concept | Definition | Vector or Scalar? | Can be negative? |
|---|---|---|---|
| Distance | Total path length traveled | Scalar | No |
| Displacement | Net change in position | Vector | Yes |
| Speed | Distance / time | Scalar | No |
| Velocity | Displacement / time (or $dx/dt$) | Vector | Yes |
| Acceleration | Rate of change of velocity ($dv/dt$) | Vector | Yes |
5. Now Try It
Problem: A cyclist moving at $v_0 = 8\ \text{m/s}$ applies the brakes, decelerating at a constant $3\ \text{m/s}^2$. Answer, showing all work:
(a) How long does it take the cyclist to stop?
(b) How far
Frequently asked about Introduction to Kinematics: Describing Motion
Get the full General Physics 211 curriculum
Clone the complete plan to your dashboard for unlimited AI-generated notes, practice quizzes, and a personalised revision schedule.
Create Free Account